Figures & data
Figure 1. The difference between risk prediction of the linear model (dashed line) and the LQ-based competition model for single doses (grey solid line) and fractionated irradiations (black solid line). The linear model appears to be valid only for organ doses below 1 Gy. (α1=0.05 Gy−1, α2=0.25 Gy−1, α/β = 5 Gy)
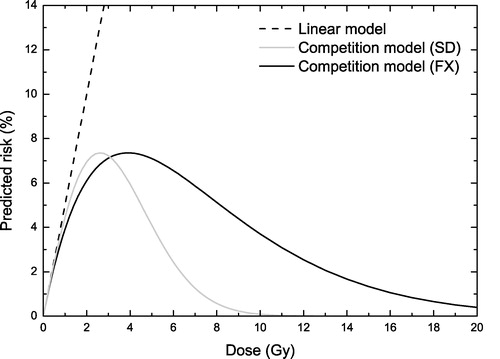
Figure 2. Competitive risk model and the irradiation of the lung at a breast treatment with 50 Gy in 25 fractions. Upper panel-the dose response curve of the competitive model for the risk of secondary cancers induction (Equation 3) in the lung. Lower panel-the dose volume histograms for the irradiation of the lung. (α1=0.017 Gy−1, α2=0.25 Gy−1, α/β = 4.5 Gy)
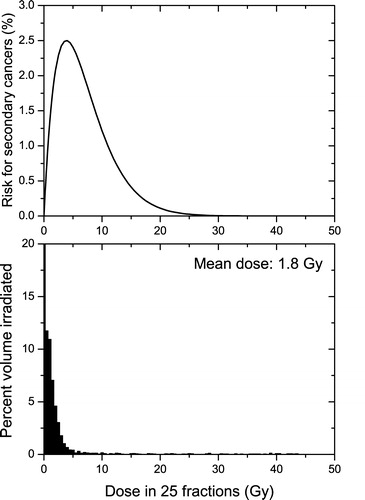
Figure 3. Competitive risk model and the irradiation of the bladder at a prostate treatment with 78 Gy in 39 fractions. Upper panel-the dose response curve of the competitive model for the risk of secondary cancers induction (Equation 3) in the bladder. Lower panel-the dose volume histograms for the irradiation of the bladder. (α1=0.006 Gy−1, α2=0.25 Gy−1, α/β = 5.4 Gy)
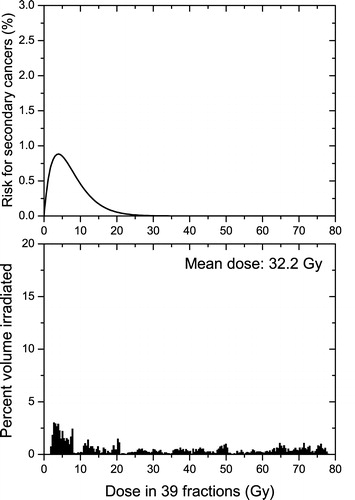
Figure 4. Competitive risk model and the irradiation of the rectum at a prostate treatment with 78 Gy in 39 fractions. Upper panel-the dose response curve of the competitive model for the risk of secondary cancers induction (Equation 3) in the rectum. Lower panel-the dose volume histograms for the irradiation of the rectum. (α1=0.017 Gy−1, α2=0.25 Gy−1, α/β = 4 Gy)
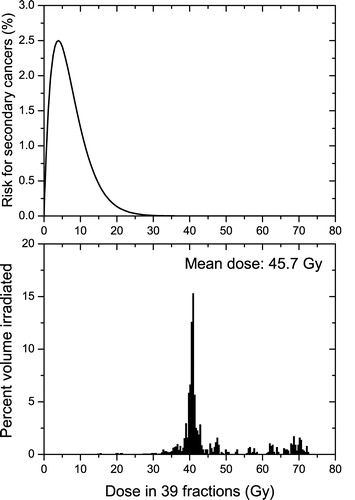
Table I. Risk predictions from different risk models and different methods to deal with dose heterogeneity throughout the irradiated organ and comparisons with clinically observed results.