Figures & data
Figure 1. Representative 31P-MR spectra obtained in a C3H mouse mammary carcinoma. Measurements were made using a 7-Tesla magnet over a 16-minute period prior to injection of ZD6126 (200 mg/kg) and 48-64 minutes after administration. Labels show the inorganic phosphate (Pi) and β-nucleoside triphosphate (β-NTP) peaks.
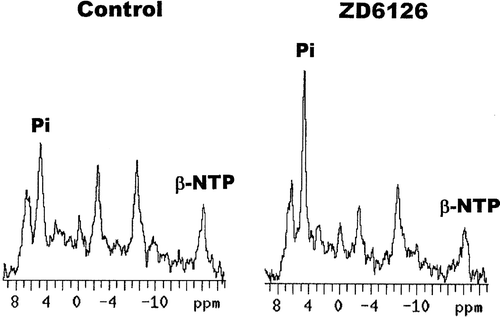
Figure 2. Drug induced changes in the β-NTP/Pi ratio or pH in a C3H mouse mammary carcinoma. Measurements were made prior to (0 hours) and up to 24-hours after treatment with either saline (○) or 150 mg/kg FAA (•). The β-NTP/Pi results are expressed relative to the pre-treatment values, while for pH the actual values are shown. All points represent the means (±1 S.E.) for 5-6 mice.
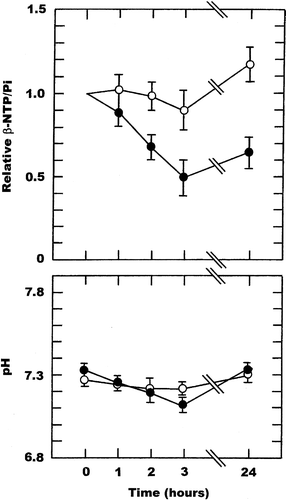
Figure 3. Drug induced changes in the β-NTP/Pi ratio or pH in a C3H mouse mammary carcinoma. Measurements were made prior to (0 hours) and up to 24-hours after treatment with DMXAA given at doses of 5 (○), 15 (▵), or 25 (•) mg/kg. The β-NTP/Pi results are expressed relative to the pre-treatment values, while for pH the actual values are shown. All points represent the means (±1 S.E.) for 5-6 mice.
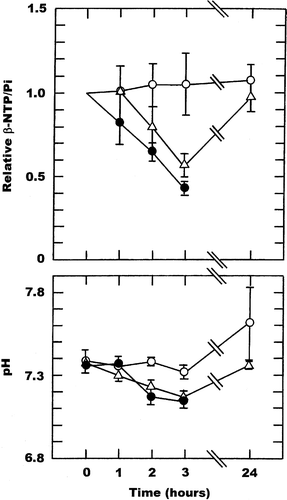
Figure 4. Drug induced changes in the β-NTP/Pi ratio or pH in a C3H mouse mammary carcinoma. Measurements were made prior to (0 hours) and up to 24-hours after treatment with CA4DP given at doses of 50 (○), 100 (▵), or 250 (•) mg/kg. The β-NTP/Pi results are expressed relative to the pre-treatment values, while for pH the actual values are shown. All points represent the means (±1 S.E.) for 4-7 mice.
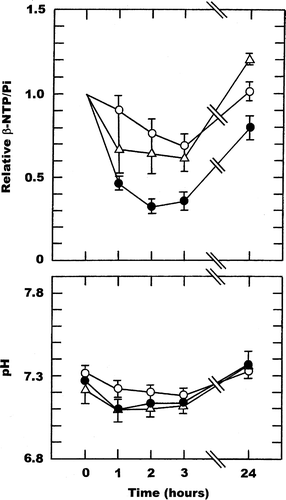
Figure 5. Drug induced changes in the β-NTP/Pi ratio or pH in a C3H mouse mammary carcinoma. Measurements were made prior to (0 hours) and up to 24-hours after treatment with ZD6126 given at doses of 100 (○) or 200 (•) mg/kg. The β-NTP/Pi results are expressed relative to the pre-treatment values, while for pH the actual values are shown. All points represent the means (±1 S.E.) for 4 mice.
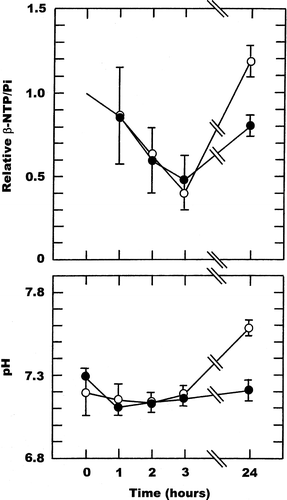
Figure 6. Representative changes in the T1 (upper panels) and T2 (lower panels) weighted images induced by ZD6126 (200 mg/kg) in a C3H mouse mammary carcinoma. For each set of images measurements were made before (left panels), or 3 (T1) and 24 (T2) hours after drug injection (right panels). The T1 weighted images show the “hot spots” which are lost after treatment, while the T2 weighted images show the increased portion of dark areas.
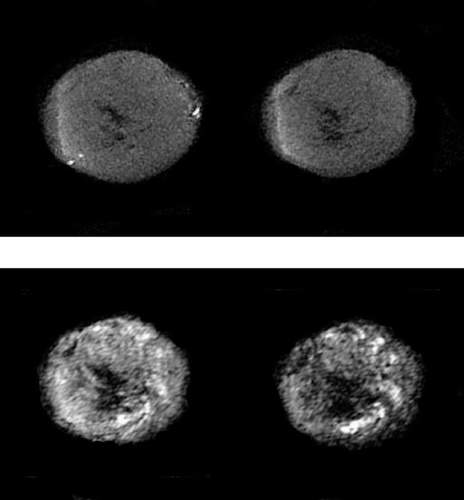
Table I. T1 weighted images: “hot spots”
Table II. T2 weighted images: percentage of dark pixels
Table III. T2 weighted images: mean signal intensity in tumour ROI