Figures & data
Figure 1. Box plot figures for direct health care costs between the two treatment groups. The boxes indicate the lower and upper quartiles and the central spot is the median. The upper end of the bar is the maximum and the lower end the minimum value.
Table I. Mean costs by items in different treatment groups, A = dose-escalated FEC and B = high-dose chemotherapy with peripheral stem cell support (standard deviation in parentheses).
Figure 2. Box-plot figures for the costs of the use of leukocyte growth factor between the groups. The boxes indicate the lower and upper quartiles and the central spot is the median. The upper end of the bar is the maximum and the lower end is the minimum value.
Figure 3. The cost-effectiveness plane with direct health rate costs (vertical axis = incremental direct health care cost, €; horizontal axis = incremental effectiveness, survival days gained). In 84% of simulated cases treatment B was both more costly and less effective (Quadrant I), and in 16% more costly, but more effective (Quadrant II).
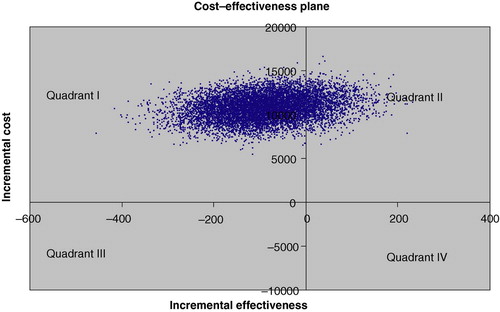
Figure 4. The cost-effectiveness plane with total costs (vertical axis = incremental total cost, €; horizontal axis = incremental effectiveness, survival days gained). In 74% of simulated cases treatment B was both more costly and less effective (Quadrant I), in 14% more costly and more effective (Quadrant II), in 10% less costly and less effective (Quadrant III), and in 2% of cases less costly and more effective (Quadrant IV).
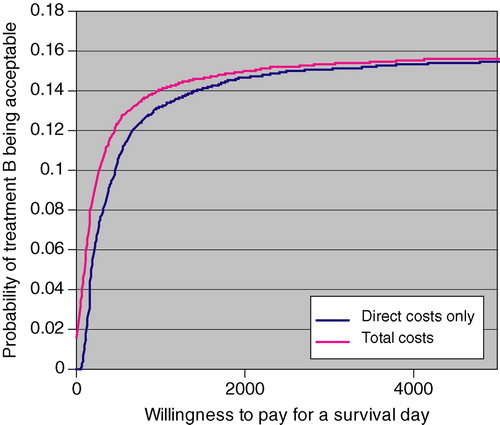
Figure 5. The cost-effectiveness acceptability curve for treatment B.