2,707
Views
39
CrossRef citations to date
0
Altmetric
ORIGINAL ARTICLE

Short and long-term survival from gastric cancer. A population-based study from a county hospital during 25 years

, &
Pages 308-315 | Received 24 May 2006, Published online: 08 Jul 2009

Figures & data

Table I.  30-days mortality related to treatment.

Table II.  Adjusted odds ratio for risk of in-hospital mortality for different risk factors (logistic regression analysis of 356 patients)

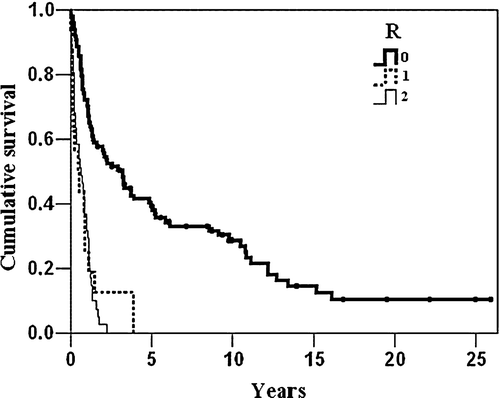
Figure 1.  Kaplan Meier curves of the overall survival distributed by R-type of resection.

Figure 1.  Kaplan Meier curves of the overall survival distributed by R-type of resection.

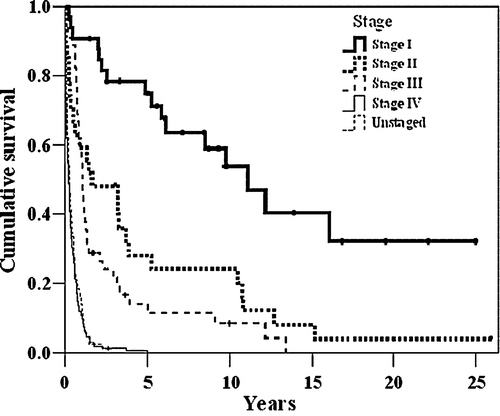
Figure 2.  Kaplan Meier curves of the overall survival distributed by the four main stages.

Figure 2.  Kaplan Meier curves of the overall survival distributed by the four main stages.

Table III.  Survival analysis using Cox's Proportional Hazards Model (analysis of 356 patients)

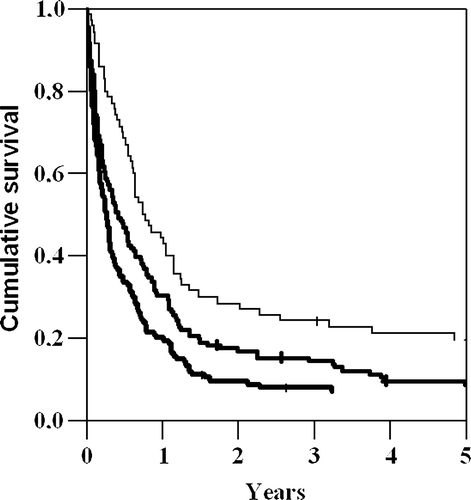
Figure 3.  Kaplan Meier curves of the overall survival distributed by the duration of symptoms.

Figure 3.  Kaplan Meier curves of the overall survival distributed by the duration of symptoms.

Table IV.  Survival analysis using Cox's Proportional Hazards Model (analysis of 354 patients)

Table V.  Post-operative mortality and 5-year survival in different studies.
Reprints and Corporate Permissions

Please note: Selecting permissions does not provide access to the full text of the article, please see our help page How do I view content?

To request a reprint or corporate permissions for this article, please click on the relevant link below:

Academic Permissions

Please note: Selecting permissions does not provide access to the full text of the article, please see our help page How do I view content?

Obtain permissions instantly via Rightslink by clicking on the button below:

If you are unable to obtain permissions via Rightslink, please complete and submit this Permissions form. For more information, please visit our Permissions help page.