1,028
Views
53
CrossRef citations to date
0
Altmetric
ORIGINAL ARTICLE

Humoral immune response to MUC1 and to the Thomsen-Friedenreich (TF) glycotope in patients with gastric cancer: Relation to survival

, , , , &
Pages 316-323 | Received 15 May 2006, Published online: 08 Jul 2009

Figures & data

Table I.  Antibody levels to MUC1, TF and αGal glycotope in patients and controls.

Figure 1.  MUC1 IgG and IgM antibody levels (medians, ranges and quartiles) in patients with gastric cancer (n = 247), chronic gastroduodenal diseases (n = 199) and blood donors (n = 100) p-values are calculated by Mann-Whitney U test. *significantly higher than in blood donors (p < 0.0001); **significantly lower compared to blood donors group (p = 0.005); ***significantly lower compared to blood donors group (p = 0.0002).
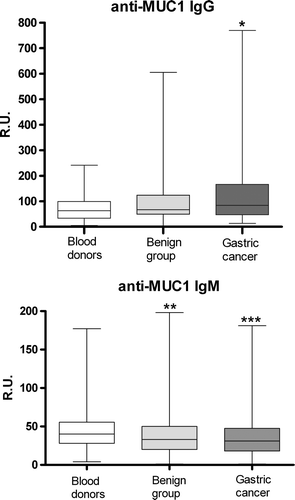
Figure 1.  MUC1 IgG and IgM antibody levels (medians, ranges and quartiles) in patients with gastric cancer (n = 247), chronic gastroduodenal diseases (n = 199) and blood donors (n = 100) p-values are calculated by Mann-Whitney U test. *significantly higher than in blood donors (p < 0.0001); **significantly lower compared to blood donors group (p = 0.005); ***significantly lower compared to blood donors group (p = 0.0002).

Figure 2.  Correlation between the levels of MUC1 IgG and TF IgG antibodies for stage I + stage II patients with gastric cancer.
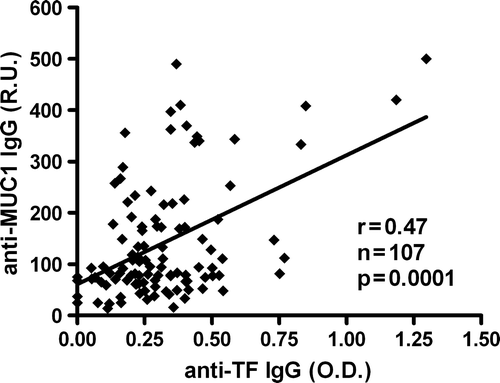
Figure 2.  Correlation between the levels of MUC1 IgG and TF IgG antibodies for stage I + stage II patients with gastric cancer.

Figure 3.  Probability of survival (Kaplan-Meier method) of gastric cancer patients in relation to TF IgG (A, B) and MUC1 IgG (C, D) antibody levels: (combined groups: stage I-IV (A, C) and stage I-III (B, D) Dark line – strong responders (O.D. or R.U. values above the median); Dotted line – weak responders (O.D. or R.U. values below or equal to the median).
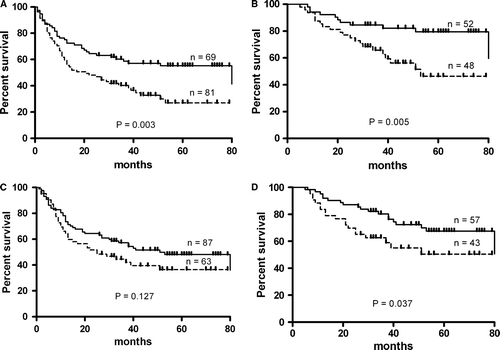
Figure 3.  Probability of survival (Kaplan-Meier method) of gastric cancer patients in relation to TF IgG (A, B) and MUC1 IgG (C, D) antibody levels: (combined groups: stage I-IV (A, C) and stage I-III (B, D) Dark line – strong responders (O.D. or R.U. values above the median); Dotted line – weak responders (O.D. or R.U. values below or equal to the median).

Figure 4.  Probability of survival (Kaplan-Meier method) of gastric cancer patients by stage in relation to MUC1 IgG antibody levels. Dark line – strong responders (R.U. values above the median); Dotted line – weak responders (R.U. values below or equal to the median).
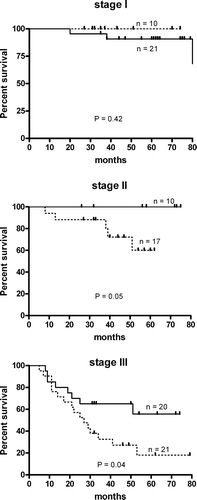
Figure 4.  Probability of survival (Kaplan-Meier method) of gastric cancer patients by stage in relation to MUC1 IgG antibody levels. Dark line – strong responders (R.U. values above the median); Dotted line – weak responders (R.U. values below or equal to the median).

Figure 5.  Probability of survival (Kaplan-Meier) of stage I-III gastric cancer patients in relation to TF IgG antibody level. Dark line – strong responders (O.D. values above the median); Dotted line – weak responders (O.D. values below or equal to the median).

Figure 5.  Probability of survival (Kaplan-Meier) of stage I-III gastric cancer patients in relation to TF IgG antibody level. Dark line – strong responders (O.D. values above the median); Dotted line – weak responders (O.D. values below or equal to the median).

Reprints and Corporate Permissions

Please note: Selecting permissions does not provide access to the full text of the article, please see our help page How do I view content?

To request a reprint or corporate permissions for this article, please click on the relevant link below:

Academic Permissions

Please note: Selecting permissions does not provide access to the full text of the article, please see our help page How do I view content?

Obtain permissions instantly via Rightslink by clicking on the button below:

If you are unable to obtain permissions via Rightslink, please complete and submit this Permissions form. For more information, please visit our Permissions help page.