Figures & data
Figure 1. Illustration of measurement sites. 1 and 3 = Essex or Aloe vera, 2 = no lotion, 4 = healthy breast. Regions 1, 2, 3 can be placed vertical or horizontal.
Figure 2. Principal Component Analysis (PCA on NIR data) score plots for three patients (a-c). The plots illustrate how individuals respond differently to the radiotherapy treatment and how the sites that are supposed to be similar might still be different.
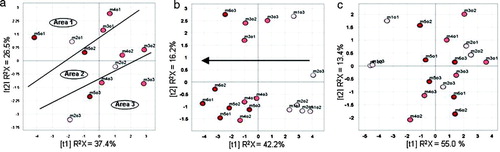
Figure 3. The developed erythema in dose interval 46–50 Gy for the lowest, highest and median individual compared to a reference photograph
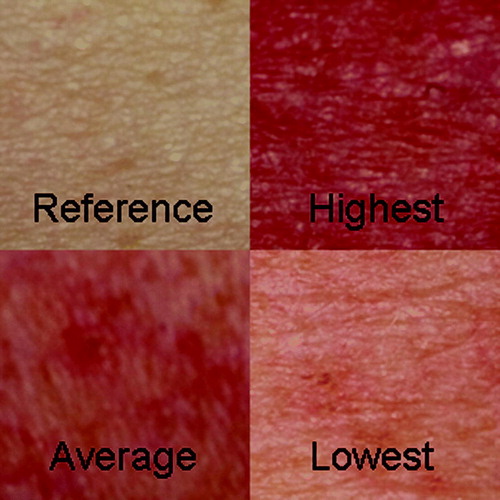
Figure 4. PCA score plot of Digital photography data. ![]()
Figure 5. Relative perfusion, i.e.: Irradiated/Reference skin, for treatment with two different lotions and no lotion as a function of radiation dose. The detection limit is calculated from the relative perfusion values at 0 Gy and is denoted with three standard deviations, 3σ.
Figure 6. The variation in relative perfusion after a radiation dose ≥36 Gy for the different treatments.