Figures & data
Figure 1. (A) Western blot analysis showing expression of EGFR, ErbB2, and actin, in human glioma 251MG, SF-767 cells, rat glioma BT4C cells, rat brain endothelial RBE4 cells, and epidermoid carcinoma A431 cells (used as positive control for EGFR). (B) Dose-response for gefitinib induced cytotoxicity to 251MG, SF-767, BT4C, and RBE4 cells after exposure to gefitinib (0–10 mg/l). (C) Western blot for phosphorylated EGFR and Akt expression of human glioma 251MG, and SF-767 cells, and of epidermoid carcinoma A431 cells (used as positive control for phophorylated EGFR), after stimulation with EGF (50 ng/ml) in the presence or the absence of gefitinib (6 mg/l).
Figure 2. Cytotoxicity to 251MG, SF-767, BT4C, and RBE4 cells after exposure for gefitinib for 30 min prior to irradiation with single doses at 2, 4, and 6 Gy, respectively, followed by continuous incubation with the drug for 6 days after irradiation of the cells. Data denote mean values±SD (standard deviation) for 16 separate observations and each figure is representative for three individual experiments. Significant difference (*p < 0.05) between irradiation alone and irradiation plus gefitinib are indicated.
Figure 3. Cytotoxicity to SF-767, BT4C, 251MG, and RBE4 cells after exposure for gefitinib for 24 h prior to irradiation with 2, 4, and 6 Gy, respectively, without following incubation with gefitinib. Data denote mean values±SD (standard deviation) for 16 separate observations and each figure is representative for three individual experiments. Significant difference (* = p < 0.05) between irradiation alone and irradiation plus gefitinib are indicated.
Figure 4. Cytotoxicity to SF-767, BT4C, RBE4, and 251MG cells after post-irradiation exposure for gefitinib at varying length of time (2–24 h) after irradiation with 2, 4, and 6 Gy, respectively. ♦ Irradiation (RT), ▭ RT + gefitinib (administrated after 2 h), Δ RT + gefitinib (administrated after 4 h),×RT + gefitinib (administrated after 8 h), ![]()
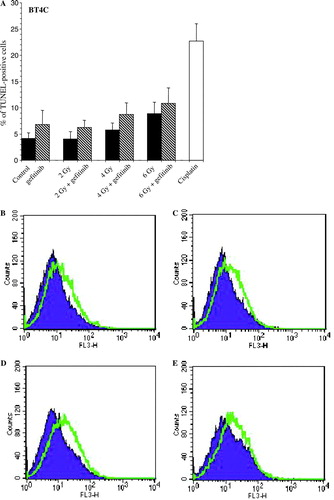
Figure 5. Histogram (A) and representative images (B-E) showing increased nuclear DNA fragmentation in rat glioma BT4C cells, 6 days after irradiation treatment (RT) with 2, 4, and 6 Gy, respectively. In the combined treatment group gefitinib was administrated 24 h after irradiation. As a positive control the cells were incubated with cisplatin (1 mg/l), which is known to induce apoptosis in this cell line. Data denotes mean values±SD (standard deviation) for three individual experiments. Significant difference (*p < 0.05) between irradiation alone and irradiation plus gefitinib are indicated. (B) control (untreated) vs. gefitinib (6 mg/l), (C) RT (2 Gy) alone vs. RT (2 Gy) + gefitinib (6 mg/l), (D) RT (4 Gy) alone vs. RT (4 Gy) + gefitinib (6 mg/l), and (E) RT (6 Gy) alone vs. RT (6 Gy) + gefitinib (6 mg/l).