Figures & data
Figure 1. Lung phantom made of cork and solid water: Axial (left) and sagittal (right) cross-sections indicating location of a cylindrical tumor model and ionization chamber channels. Films were placed horizontally at the isocentric plane and 40 mm above and below it.
Table I. Percentage differences between calculated and measured isocentric doses for all test geometries and all possible TPS, algorithm (PB vs. CC) and energy combinations.
Table II. Single-beam test. Percentage area of the ROI (10201 calc. points) which failed the 3% dose and 3 mm DTA criteria i.e. with γ ≥ 1. Data refers to three horizontal planes at different depths; for all possible TPS, algorithm (PB vs. CC) and energy combinations.
Table III. Multiple-conformal-beam test. Percentage area of the ROI (29141 calc. points) which failed the 3% dose and 3 mm DTA criteria i.e. with γ ≥ 1. Data refers to three horizontal planes at different depths; for all possible TPS, algorithm (PB vs. CC) and energy combinations.
Figure 2. Coronal γ distributions at the isocentric plane of the lung phantom for multiple-beam IMRT arrangement: Grey areas indicate dose calculation points with γ ≥ 1 i.e. not meeting 3% dose or 3 mm DTA criterion. γ distribution is displayed on background of TPS-calculated (dotted lines) and film-measured (solid lines) isodoses (20%, 50%, 80% and 90%). Rectangles indicate the ROI chosen for γ analysis. a) BrainSCAN 6MV PB (pencil beam) b) Helax-TMS 6MV PB c) Helax-TMS 6MV CC (collapsed cone) d) Helax-TMS 25MV PB e) Helax-TMS 25MV CC.
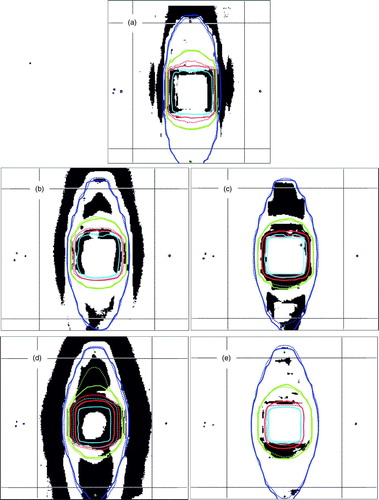
Table IV. Multiple-beam IMRT test. Percentage area of the ROI (29141 calc. points) which failed the 3% dose and 3 mm DTA criteria i.e. with γ ≥ 1. Data refers to three horizontal planes at different depths; for all possible TPS, algorithm and energy combinations. (PB … pencil beam; CC … collapsed cone).
Table V. Multiple-beam IMRT tests. Percentage of calculation points with γ ≥ 1 within the ROI (29141 calc. points) in the isocenter plane for five different TPS-calculated dose bins (dTPS). Last two rows correspond to the number of points with γ ≥ 1 presented in .
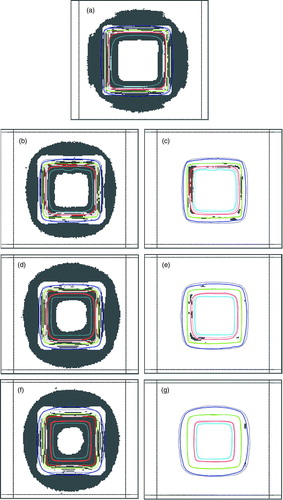
Figure 3. Coronal γ distributions at the isocentric plane of the lung phantom for single-beam arrangement: Grey areas indicate dose calculation points with γ ≥ 1 i.e. not meeting 3% dose or 3 mm DTA criterion. γ distribution is displayed on background of TPS-calculated (dotted lines) and film-measured (solid lines) isodoses (20%, 50%, 80% and 90%). Rectangles indicate the ROI chosen for γ analysis. a) BrainSCAN 6MV PB (pencil beam) b) Helax-TMS 6MV PB c) Helax-TMS 6MV CC (collapsed cone) d) Helax-TMS 10MV PB e) Helax-TMS 10MV CC f) Helax-TMS 25MV PB g) Helax-TMS 25MV CC.