Figures & data
Figure 1. A flow diagram for participants. The number of participants satisfying the criteria for inclusion that did or did not undergo the index tests and/or the reference standard is reported here. The reasons why participants failed to receive either test are also described.
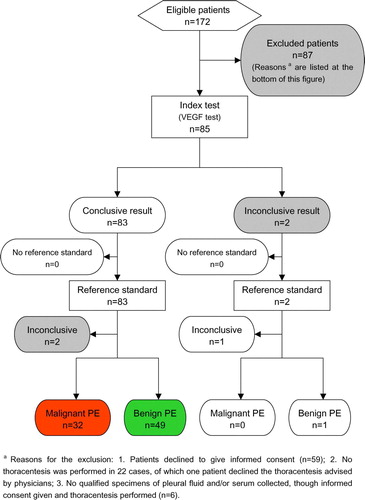
Table I. Key clinical and demographic characteristics of the study population [Means (SDs) except as noted].
Figure 2. Standard curves and ROC curves in VEGF tests. A, (a) and (b) indicate the standard curves in VEGF tests on PF and serum, respectively; B, (c) and (d) show the ROC curves in VEGF tests on PF and serum, with the areas under the curves 0.686 (p = 0.005) and 0.834 (p < 0.001), respectively.
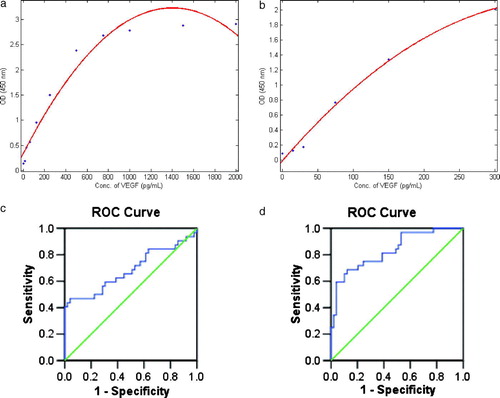
Figure 3. Box-whisker plots representing the results of VEGF test on PF (a) and serum (b) in both groups. For PF VEGF level, the mean in malignant group was higher than that in benign group (1358±1493 pg/mL vs. 422±317 pg/mL, p = 0.001). As did for serum VEGF level (650±533 pg/mL vs. 137±189 pg/mL, p < 0.001).
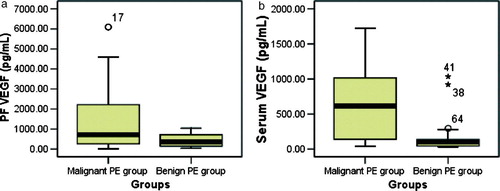
Table II. Results of VEGF test with the diagnostic cut-off points.
Table III. Sensitivities and specificities of different VEGF test strategies [Rates of sample (95% confidence intervals)].