1,770
Views
29
CrossRef citations to date
0
Altmetric
ORIGINAL ARTICLE

Epidermal growth factor (EGF) A61G polymorphism and EGF gene expression in normal colon tissue from patients with colorectal cancer

, , , &
Pages 1113-1117 | Received 06 Feb 2007, Published online: 08 Jul 2009

Figures & data

Table I.  Patient characteristics.

Figure 1.  Distribution of age and EGF gene expression levels in normal colon tissue according to EGF A61G genotype. The left side boxplots (orange) represent the EGF gene expression levels in normal colon and the right side box plots (blue) the age in years.

Figure 1.  Distribution of age and EGF gene expression levels in normal colon tissue according to EGF A61G genotype. The left side boxplots (orange) represent the EGF gene expression levels in normal colon and the right side box plots (blue) the age in years.

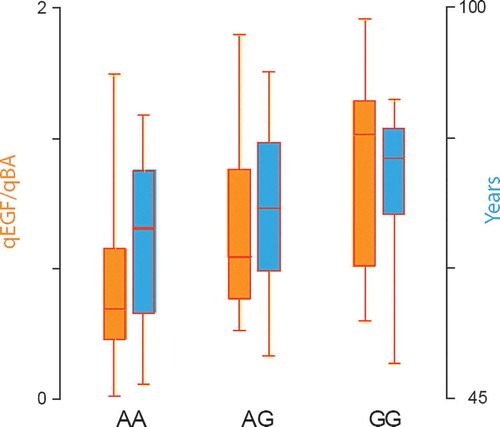
Table II.  Median gene expression levels according to EGF A61G genotype (*p < 0.05).

Figure 2.  Scatter plot of EGF gene expression in CRC versus normal colon tissue.

Figure 2.  Scatter plot of EGF gene expression in CRC versus normal colon tissue.

Figure 3.  EGF gene expression levels in colon tumour and normal colon tissue.

Figure 3.  EGF gene expression levels in colon tumour and normal colon tissue.

Reprints and Corporate Permissions

Please note: Selecting permissions does not provide access to the full text of the article, please see our help page How do I view content?

To request a reprint or corporate permissions for this article, please click on the relevant link below:

Academic Permissions

Please note: Selecting permissions does not provide access to the full text of the article, please see our help page How do I view content?

Obtain permissions instantly via Rightslink by clicking on the button below:

If you are unable to obtain permissions via Rightslink, please complete and submit this Permissions form. For more information, please visit our Permissions help page.