Figures & data
Figure 1. Age at diagnosis of esophageal cancer patients in Stockholm County 1978–1995. (n = 1284)
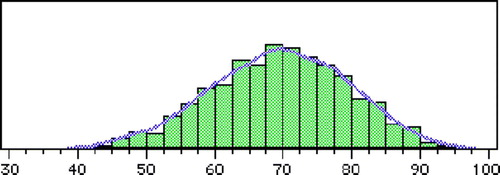
Figure 2. Age-specific incidence (cases/100 000) of esophageal cancer in Stockholm County 1978–1995. (n = 1284)
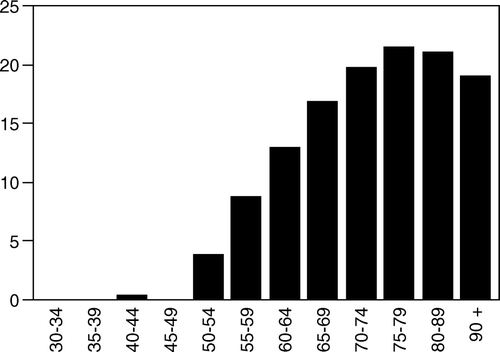
Figure 3. Age-specific incidence (case/100 000) of esophageal cancer in Stockholm County 1978–1995 for three age groups.
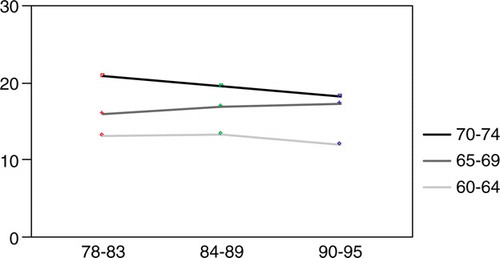
Table I. Dysphagia among esophageal cancer patients in Stockholm County 1978–1995.
Table II. Histological subgroups among esophageal cancer patients in Stockholm County 1978–1995. (n = 1284)
Figure 4. The incidence of esophageal cancer/100 000 in Stockholm County 1978–1995. The incidences of the major histological types are indicated.
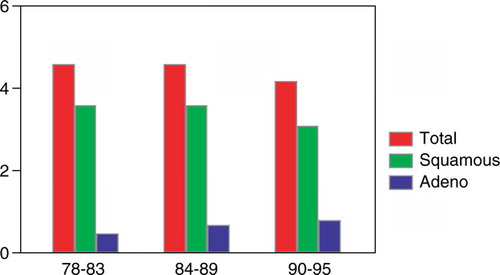
Figure 5. The incidence of squamous cell carcinoma of the esophagus/100 000 among men and women in Stockholm County 1978–1995.
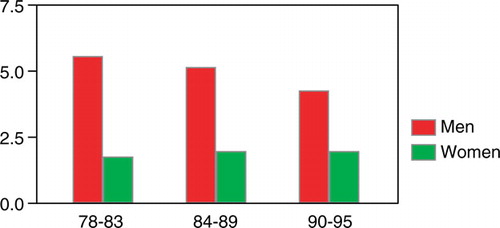
Figure 6. The incidence of adenocarcinoma of the esophagus/100 000 among men and women in Stockholm County 1978–1995.
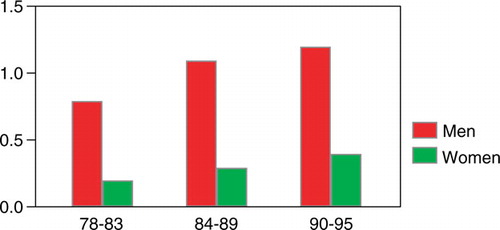
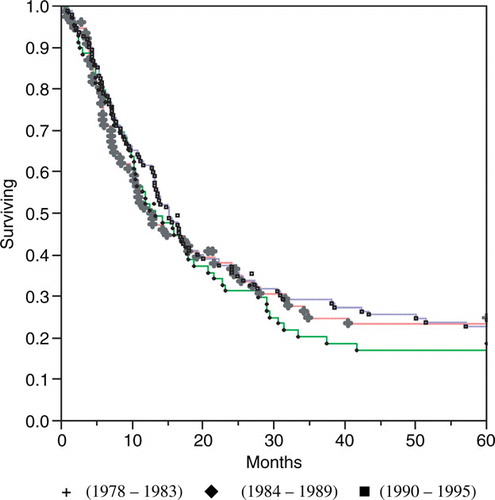
Figure 7. Disease-specific survival among esophageal cancer patients in Stockholm County 1978–1995 according to the Kaplan Meier method.
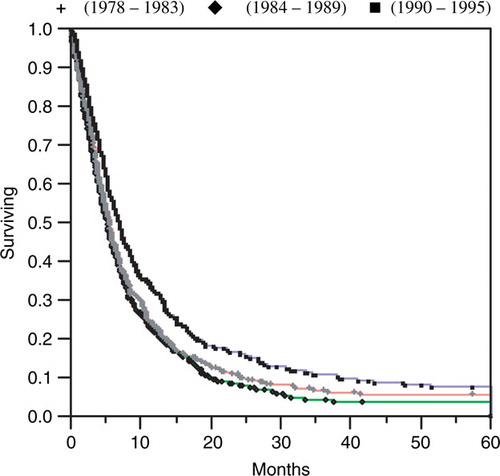
Figure 8. Disease-specific survival among resected esophageal cancer patients (n = 264) in Stockholm County 1978–1995 according to the Kaplan Meier method.