Figures & data
Table I. Clinical data of the 30 colorectal cancer patients in the study.
Figure 1. FISH analyses of LRIG1 locus in colorectal cancer cells from two patients. (A) Nuclei showing normal gene copy number (two copies per nucleus) of the LRIG1 gene. (B) Nuclei showing increased gene copy number (more than two copies per nucleus) of the LRIG1 gene at 3p14. Analysis was performed with a specific LRIG1 probe (red).
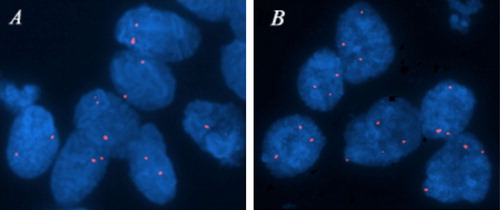
Figure 2. Example of Western blot analyses of LRIG1 in samples from two colorectal cancer patients. For comparison, the samples were stepwise diluted by 50% in three steps. Tumours (T) versus matched non-neoplastic tissue (N) from the same patient. Pat 6 was considered underexpressing the LRIG1 protein in the tumour compared to adjacent non-neoplastic tissue and Pat 12 was considered as overexpressing the LRIG1 protein in the tumour compared to non-neoplastic tissue.
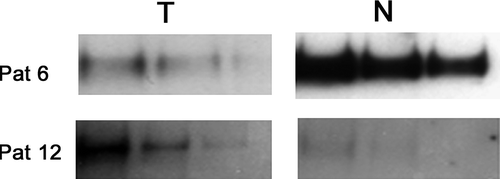
Table II. Crosstable of LRIG1 Western blot (WB) results and immunohistochemical (IHC) EGFR scores in 30 colorectal cancer samples and matching adjacent non-neoplastic tissue.
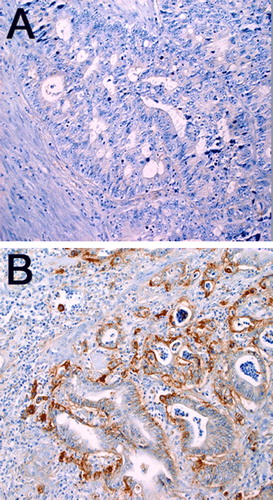
Figure 3. Immunohistochemical analyses of EGFR in primary colorectal tumors. (A) Negative staining in colorectal cancer cells and surrounding tissues. (B) Positive membranous staining in more than 10% of colorectal cancer cells (original magnification ×20), and mostly negative staining in surrounding tissues.