Figures & data
Figure 1. Δ9-THC induce cell death in human glioblastoma multiforme cell lines through G0-G1 transition (G1 arrest). A, dose-dependent effect of Δ9-THC on cell viability is shown by the MTT assay. U251-MG (upper) and U87-MG (lower) cells were treated with increasing concentration of Δ9-THC (0, 5, 10, 15, 20, 30, 40, and 50 µg/ml) compared with untreated cells (“Time 0”) for 24 (left) and 48 h (right). Columns, mean of three different measurements; bars, ±SD; *, p < 0.05; **, p < 0.01; ***, p < 0.001 versus untreated cells. B, effect of Δ9-THC on induction of G0/1 arrest. Cell cycle profile was evaluated by propidium iodide staining and FACS analysis (as indicated in Materials and methods). The fractions of cells in G1 phase increased in both GBM cell lines with the reduction of cells in S phase and G2 phase after treatment with 10 µg/ml Δ9-THC for 24 h in U251-MG and 20 µg/ml Δ9-THC for 48 h in U87-MG. The percentages of gated cells are indicated, ±SD; *, p < 0.05. C, representative image of GBM cell cultures captured from each well by using a camera attached to an inverted microscope (Leica DMIL, Germany). U87-MG and U251-MG were incubated for 0 h (I, III) and for 24 h with 20 µg/ml Δ9-THC (II, IV). Cytoplasm swelling and formations of membrane bound vesicles are observed post treatment with Δ9-THC.
Figure 2. Δ9-THC decreases E2F1 protein and RNA expression levels in both human GBM cell lines. A, western blot analysis shows a significant decrease of nuclear E2F1 resulting from treatment with 20 µg/ml Δ9-THC for 24 and 48 h when compared to untreated cells (set as 100%). Nuclear extract was prepared from buffer C (as mentioned in the Material and methods), and the membrane was probed over night at 4°C with primary monoclonal E2F1 antibody. Actin serves as loading control. Results were analyzed by densitometry and expressed as a percentage of the intensity value of untreated cells. Columns, mean of four different measurements; bars, ±SD; *, p < 0.05; **, p < 0.01; ***, p < 0.001 versus untreated cells. B, verification by QRT-PCR confirms the decrease in E2F1 protein expression levels, by significant decrease in its RNA expression levels, after treatment of Δ9-THC for 24 and 48 h using the SYBR Green PCR Master Mix. E2F1 gene expression was normalized to GAPDH gene and presented as a percentage to corresponding control (set as 100%). Columns, mean of three different measurements; bars, ±SD; *p < 0.05, **p < 0.01, ***p < 0.001 statistical significant differences. C, U87-MG and D, U251-MG cells were plated on glass coverslips with or without 20 µg/mL Δ9-THC for 24 and 48 h then fixed with methanol, incubated for 2 h with monoclonal E2F1 antibody, washed extensively with TBS, and incubated for 1 h with E2F1-secondary Ab (Rhodamine Red-X). Cells were counterstained with 4′,6-diamidino-2-phenylindole (DAPI). Slides were then mounted and examined using a fluorescence microscope. Photographs were taken at the same magnification (×40) and then transported to Photoshop.
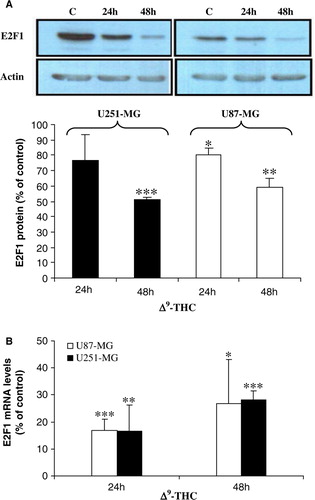
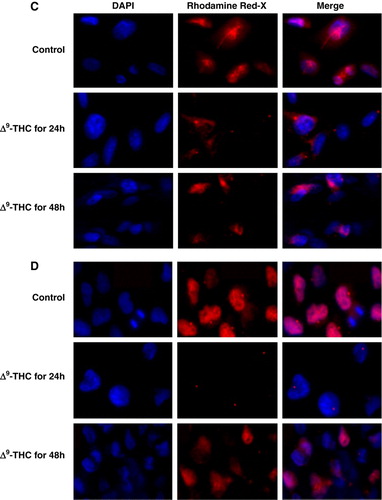
Figure 3. Δ9-THC effect on protein levels and on genes that are involved in cell cycle progression. A, Cyclin A protein levels in U251-MG and U87-MG cells (upper) were prominently downregulated due to 20 µg/ml of Δ9-THC for 24 and 48 h when compared to untreated cells. p16INK4A levels in nuclear fractions of the cells were elevated after 24 h of treatment in both cell lines (lower). Actin was used as a loading control. Analyses were repeated at least three times. Expressions of the different proteins are represented as O.D. relative to respective controls at the designated time-points (set at 100). B, verification of expressions of cell cycle related genes using QRT-PCR. Upper, Cyclin A RNA levels were significantly decreased in both cell lines, respectively to the Western results. Thymidylate synthase (lower), E2F1 upregulated enzyme, expression levels were downregulated in U87-MG and significantly in U251-MG after 24 and 48 h of treatment with 20 µg/ml Δ9-THC corresponding to E2F1 RNA levels as indicated previously. All genes expression levels were normalized to GAPDH gene and presented as a fold increase relative to corresponding control. Columns, mean of three different measurements; bars, ±SD; * p < 0.05, ***p < 0.001 statistical significant differences.
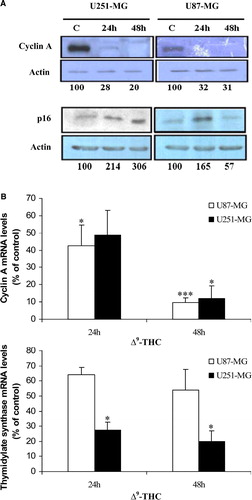
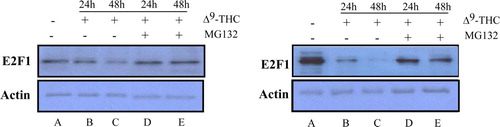
Figure 4. E2F1 protein levels might be mediated via the proteasome degradation. We assessed the protein expression levels of E2F1 by Western blot analysis on two different GBM cell lines; U87-MG (left) and U251-MG (right). Cells were treated in the absence (lane A) or presence of 20 µg/ml Δ9-THC for 24 h (lane B) and 48 h (lane C). To determine whether decrease in E2F1 levels is mediated by the proteasome machinery, we employed MG132, a proteasome inhibitor. 3 µM MG132 were added for 8 h to cell culture kept in presence of Δ9-THC for 24 h (lane D) and 48 h (lane E). Increased levels of E2F1 are shown in lanes D and E. E2F1 protein levels were determined from the nuclear extract. Actin was used as loading control.