Figures & data
Figure 1. The x-ray used for the target determination showing the reference point for the MA measurements. The levels of the CT-slices are indicated at the margin. The position of the patient is not standard because of the small scan diameter of the CT-scanner.
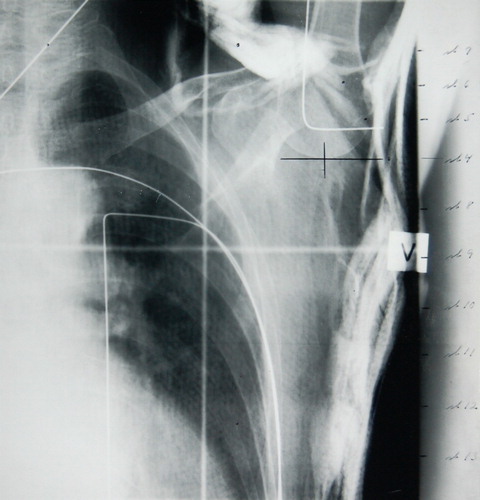
Table I. DBCG Recommendations for postmastectomy radiotherapy 1977–2007.
Figure 2. Left: The upper curve shows the common peak dose of 54.0 Gy in 24 fractions for all patients and the lower curve indicate the dose to the later defined the midaxilla (MA) target depth. Middle: The lower curve is the prescribed minimum dose to the target and the upper curve is the corresponding peak dose. For big a-p diameters the minimum dose drops down due to the upper dose limit of 54.0 Gy for the peak dose.Right: The median dose concept results in symmetrical peak and minimum doses. The demand for a dose deviation less than + 10% cause a energy shift for big a-p diameters.
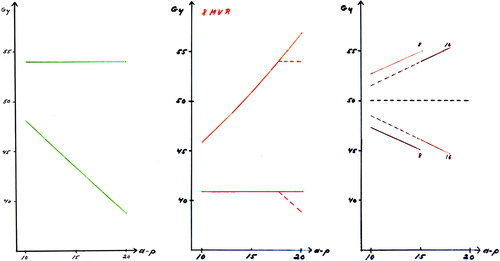
Figure 3. DBCG 77: I: Anterior photon field including supra/infraclavicular region arid axillary region, lI: Bolus covered part of the anterior photon field. III: Anterior electron field. A: Reference point for mid-plane of axillary field and measurement of anterior-posterior diameter (A-P diameter). For further details, see Overgaard et al. Citation[18]. DBCG 82. Left: The anterior combined photon/electron 3-field technique which was most commonly used in the DBCG 82 b&c trials. Field I: anterior photon field. Fields II and III: anterior electron fields. Larynx and shoulder joint are blocked and a wax bolus covers the scar area in the photon field area. Right: The wide tangential field technique. Field I: anterior photon field, with blocking of larynx and shoulder joint. Fields II and II: opposed tangential photon fields with the medial field border being located 3 cm contralateral to midsternum. From Nielsen et al. Citation[45]. DBCG 89. Treatment fields to patients with ≥ 10 nodes removed. Left figure: Anterior photons fields to periclavicular and level 3 axillary nodes and lateral chest wall with lung blocks. Right figure: Anterior electron field covering remaining part of chest wall and IMN.DBCG 03. Treatment fields to patients with ≥ 10 nodes removed. Anterior combined photon and electron fields covering periclaviculary area, level 3 axillary nodes and chest wall. IMN only included in patients with right-sided tumours.
![Figure 3. DBCG 77: I: Anterior photon field including supra/infraclavicular region arid axillary region, lI: Bolus covered part of the anterior photon field. III: Anterior electron field. A: Reference point for mid-plane of axillary field and measurement of anterior-posterior diameter (A-P diameter). For further details, see Overgaard et al. Citation[18]. DBCG 82. Left: The anterior combined photon/electron 3-field technique which was most commonly used in the DBCG 82 b&c trials. Field I: anterior photon field. Fields II and III: anterior electron fields. Larynx and shoulder joint are blocked and a wax bolus covers the scar area in the photon field area. Right: The wide tangential field technique. Field I: anterior photon field, with blocking of larynx and shoulder joint. Fields II and II: opposed tangential photon fields with the medial field border being located 3 cm contralateral to midsternum. From Nielsen et al. Citation[45]. DBCG 89. Treatment fields to patients with ≥ 10 nodes removed. Left figure: Anterior photons fields to periclavicular and level 3 axillary nodes and lateral chest wall with lung blocks. Right figure: Anterior electron field covering remaining part of chest wall and IMN.DBCG 03. Treatment fields to patients with ≥ 10 nodes removed. Anterior combined photon and electron fields covering periclaviculary area, level 3 axillary nodes and chest wall. IMN only included in patients with right-sided tumours.](/cms/asset/5ecdf8a5-d940-49f9-9b76-7fa1f619dbe6/ionc_a_307974_f0003_b.jpg)
Figure 4. Determination of the two equivalent doses (no of fx/fx per wks/total days) used for the recommended fractionations.
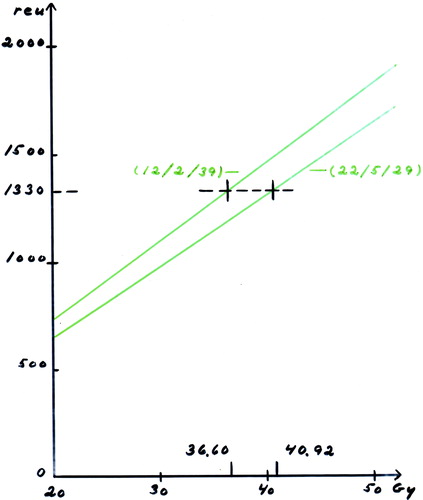
Figure 5. Some of the proposals for the target. The green line indicates the DBCG target. The slice shows the situation at the midaxilla (MA) reference point.
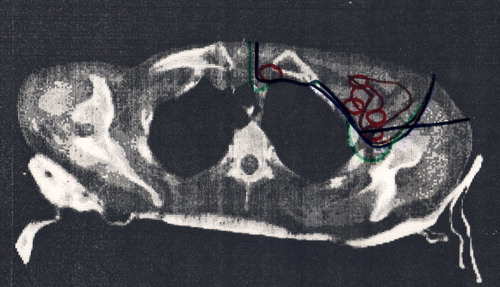
Figure 6. The depth of DBCG target defined from CT slices with 2 cm interval. The depth of the dashed curves is equal to the corresponding colored curves plus 0.5 cm.
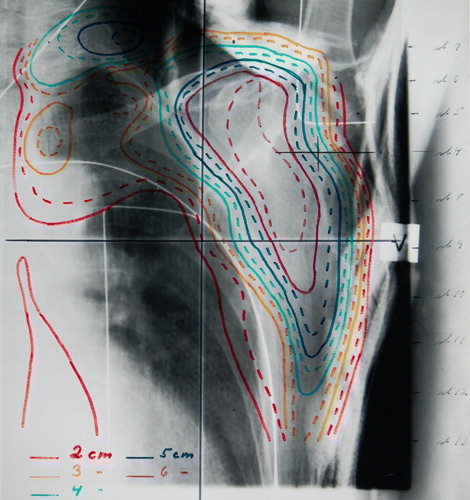
Figure 7. A scan in the thorax region with indication of the lung and the DBCG target. The tree colored lines point out the borderlines between the photon and electron field. The magenta line marks a vertical beam at the inside of the thorax wall. The blue line is situated 1 cm inside the lung. The red line shows the situation with the gantry turned 10-15 degrees from vertical position and the borderline 1 cm inside the lung defined by an x-ray. At the right side of the figure the depth of the DBCG target is indicated by the green lines for a number of slices. The tree colored lines marks the borderlines between the photon and electron field. The black dot at the surface shows the separation of the parasternal and the scar region.
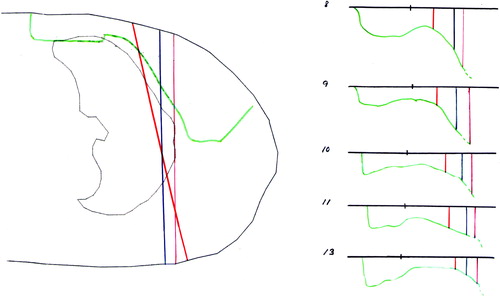
Figure 8. Left: The depth dose curve for the open field is shown in black. To this curve we have to add the dose from electron contamination from the Perspex tray (green) and the transmitted photon dose from the electron fields. Middle: To the standard 10 MeV electron depth dose we must add the contribution from the photon field containing electron contamination and photon transmission. And on top of that the photon transmission from the electron field adds up. Right: The same situation as in Figure 6b but the transmitted dose is higher due to the higher electron energy.
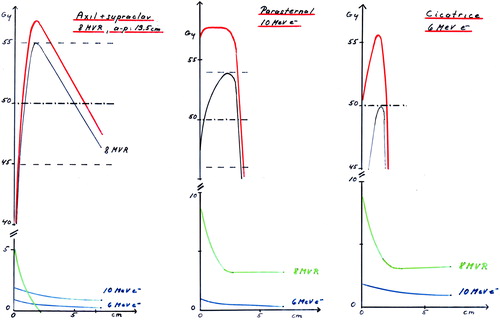
Table II. DBCG recommendations for radiotherapy after breast conserving surgery (BCS) 1977–2007.
Table III. Timing of radiotherapy (RT) and chemotherapy in DBCG.