1,253
Views
29
CrossRef citations to date
0
Altmetric
Original Article

Midgut carcinoid patients display increased numbers of regulatory T cells in peripheral blood with infiltration into tumor tissue

, , , , , , & show all
Pages 391-400 | Received 15 Apr 2008, Published online: 08 Jul 2009

Figures & data

Figure 1.  Midgut carcinoid patients display increased Treg prevalence in peripheral blood. Patients display increased Treg prevalence based on (A) CD4+CD25+ stainings (patients n=46, healthy n=14) (B) CD4+FoxP3+ stainings (patients n=30, healthy n=21) (C-D) CD4+CD25+CD127 stainings (patients n=12, healthy n=10) (p<0.05). Evaluated cells were gated on the lymphocyte population based on a forward and side scatter dot plot and percentages have been calculated based on the total CD4+ population. Individual values are shown as filled circles and the mean value is indicated with a line. Representative FACS plots are shown, in the right panels of A, B and C. (D) A significant fraction of the CD127 population is FoxP3+ positive in comparison to the CD127+ population both in patients and healthy controls. FoxP3+ cells are labelled black in the dot plot shown in C, compared to the grey Foxp3 cells.

Figure 1.  Midgut carcinoid patients display increased Treg prevalence in peripheral blood. Patients display increased Treg prevalence based on (A) CD4+CD25+ stainings (patients n=46, healthy n=14) (B) CD4+FoxP3+ stainings (patients n=30, healthy n=21) (C-D) CD4+CD25+CD127− stainings (patients n=12, healthy n=10) (p<0.05). Evaluated cells were gated on the lymphocyte population based on a forward and side scatter dot plot and percentages have been calculated based on the total CD4+ population. Individual values are shown as filled circles and the mean value is indicated with a line. Representative FACS plots are shown, in the right panels of Figure 1A, B and C. (D) A significant fraction of the CD127− population is FoxP3+ positive in comparison to the CD127+ population both in patients and healthy controls. FoxP3+ cells are labelled black in the dot plot shown in Figure 1C, compared to the grey Foxp3− cells.

Figure 2.  Patient PBMCs are less responsive to polyclonal T cell activation compared to healthy controls. (A) Patient PBMCs (n=10) proliferate poorly in response to polyclonal activation with OKT3 and IL-2 in comparison to healthy controls (n=10, p<0.02). Proliferation of triplicate samples was measured continuously for 6 days with AlamarBlue. Mean absorbance values at indicated days are plotted with SD. (B) The CD25+ fraction of patient lymphocytes are highly resistant to polyclonal stimuli. The CD25 fraction remains hyporesponsive after removal of the CD25+ population and do not reach mean values for healthy donors, shown in A. Mean absorbance values at indicated days for the CD25+ and CD25 populations from 5 patients are plotted with SD.

Figure 2.  Patient PBMCs are less responsive to polyclonal T cell activation compared to healthy controls. (A) Patient PBMCs (n=10) proliferate poorly in response to polyclonal activation with OKT3 and IL-2 in comparison to healthy controls (n=10, p<0.02). Proliferation of triplicate samples was measured continuously for 6 days with AlamarBlue. Mean absorbance values at indicated days are plotted with SD. (B) The CD25+ fraction of patient lymphocytes are highly resistant to polyclonal stimuli. The CD25− fraction remains hyporesponsive after removal of the CD25+ population and do not reach mean values for healthy donors, shown in Figure 2A. Mean absorbance values at indicated days for the CD25+ and CD25− populations from 5 patients are plotted with SD.

Figure 3.  Patient CD25+ lymphocytes suppress allogeneic activation. CFSE-labelled healthy donor lymphocytes were mixed with the CD25+ and the CD25 cell fraction of patient lymphocytes in various ratios on a 96 well plate. The cells were cultured for 5 days when cell proliferation was determined by FACS analysis of CFSE dilution. Responder cells mixed with patient CD25 cells proliferated extensively while patient CD25+ cells suppressed proliferation down to 10:1 ratio. Cells were gated on the lymphocyte gate in a forward and side scatter dot plot and comparable numbers of gated events were counted for each ratio. The experiment was performed 3 times using blood from 3 healthy donors and 3 patients.

Figure 3.  Patient CD25+ lymphocytes suppress allogeneic activation. CFSE-labelled healthy donor lymphocytes were mixed with the CD25+ and the CD25− cell fraction of patient lymphocytes in various ratios on a 96 well plate. The cells were cultured for 5 days when cell proliferation was determined by FACS analysis of CFSE dilution. Responder cells mixed with patient CD25− cells proliferated extensively while patient CD25+ cells suppressed proliferation down to 10:1 ratio. Cells were gated on the lymphocyte gate in a forward and side scatter dot plot and comparable numbers of gated events were counted for each ratio. The experiment was performed 3 times using blood from 3 healthy donors and 3 patients.

Figure 4.  Patients present a systemic cytokine profile shifted from Th1 towards Th3. Serum levels of the cytokines IL-12p70, IL-1β, TGFβ, IL-10, IL-6 and IL-8 were measured by CBA and ELISA in patients (n=25) and healthy controls (n=18, IL-1β n=10, TGFβ n=8). There was a significant reduction in the pro-inflammatory cytokines IL-12p70 and IL-1β in patients (as indicated by asterisks) and a slight increase in TGFβ. IL-8 was significantly increased in patients compared to healthy controls. Data is displayed as box plots, all values are included and the box extends from the 25th to the 75th percentile with median value indicated.

Figure 4.  Patients present a systemic cytokine profile shifted from Th1 towards Th3. Serum levels of the cytokines IL-12p70, IL-1β, TGFβ, IL-10, IL-6 and IL-8 were measured by CBA and ELISA in patients (n=25) and healthy controls (n=18, IL-1β n=10, TGFβ n=8). There was a significant reduction in the pro-inflammatory cytokines IL-12p70 and IL-1β in patients (as indicated by asterisks) and a slight increase in TGFβ. IL-8 was significantly increased in patients compared to healthy controls. Data is displayed as box plots, all values are included and the box extends from the 25th to the 75th percentile with median value indicated.

Figure 5.  Midgut carcinoids demonstrate lymphocyte infiltration including FoxP3+ cells. Presence of tumor infiltrating lymphocytes was detected by immunohistochemistry (n=10) and immunofluorescence microscopy (n=10). Inflammatory foci with CD4+ and CD8+ cells in the tumor area are shown at 20x magnification. A representative immunofluorescent staining of FoxP3+-expressing CD4+ cells, with CD4+ indicated by red and FoxP3+ by green, is also shown.

Figure 5.  Midgut carcinoids demonstrate lymphocyte infiltration including FoxP3+ cells. Presence of tumor infiltrating lymphocytes was detected by immunohistochemistry (n=10) and immunofluorescence microscopy (n=10). Inflammatory foci with CD4+ and CD8+ cells in the tumor area are shown at 20x magnification. A representative immunofluorescent staining of FoxP3+-expressing CD4+ cells, with CD4+ indicated by red and FoxP3+ by green, is also shown.

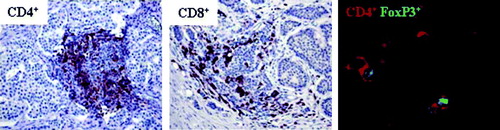
Table I.  Tumor infiltrating CD4+ and CD8+ cells.

Table II.  Tumor infiltrating CD4+FoxP3+ cells.

Reprints and Corporate Permissions

Please note: Selecting permissions does not provide access to the full text of the article, please see our help page How do I view content?

To request a reprint or corporate permissions for this article, please click on the relevant link below:

Academic Permissions

Please note: Selecting permissions does not provide access to the full text of the article, please see our help page How do I view content?

Obtain permissions instantly via Rightslink by clicking on the button below:

If you are unable to obtain permissions via Rightslink, please complete and submit this Permissions form. For more information, please visit our Permissions help page.