Figures & data
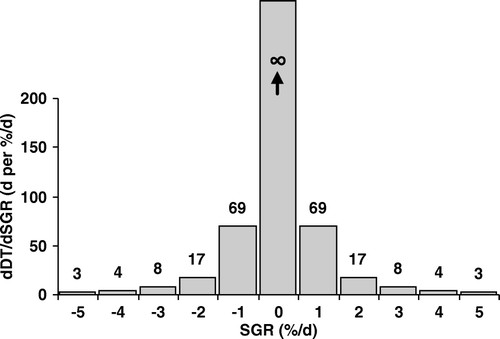
Figure 1. Change in DT per %/d change in SGR, dDT/dSGR, versus SGR. dDT/dSGR changes slightly for rapidly growing tumors, whereas it changes largely for slowly growing tumors and approaches ∞ when SGR approaches zero, i.e., DT approaches ∞.

Table I. Results of computer simulation. SGR and DT values are presented for all tumors in both groups, assuming mean SGR values of 1%/d and 1.5%/d in group 1 and 2, respectively, and a standard deviation of 0.5%/d in both groups.
Figure 2. Frequency distribution of SGR (panel-A) and corresponding DT values (panel-B). The computer simulation was done similar to the simulation for the tumors in group 1 (Table I), but the number of tumors was assumed to be 10 000 in order to obtain a better statistics.

Table II. Increase rate of PSA level before and after treatment initiation. DT values were retrieved from a previously published clinical study, Guess et al. (2003) [5], and the corresponding SGR values were calculated (Equation B). The difference between DT of PSA level before and after treatment is not statistically significant (p > 0.1). The difference between SGR of PSA level before and after treatment is statistically significant (p < 0.002). Note: Patient ID is the same ID used in the original paper. Data reprinted with permission of John Wiley & Sons, Inc.
Table III. Growth rate of tumor volume as well as the increase rate of serum CA 19-9 in 11 patients with pancreatic cancer. DT values were retrieved from a previously published clinical study, Nishida et al. (1999) [6], and the corresponding SGR values were calculated (Equation B). The correlation between DT of CA 19-9 level and DT of tumor volume is statistically significant (p < 0.0001). The correlation between SGR of CA 19-9 and SGR of tumor volume is not statistically significant (p > 0.3). Note: Patient no. is the case number used in the original paper. Data reprinted with permission of John Wiley & Sons, Inc.
