Figures & data
Table I. Summary of DVH analysis for PTV and OAR for the cohort of 8 breast cancer patients included in this study, for 4 fields conventional, IMRT and RA treatment techniques. Data are shown as mean values plus or minus one standard deviation; in brackets the range. The patients were treated planned for 6 MV beams to a dose of 50 Gy in 25 fractions.
Figure 1. Dose volume histograms in cumulative form showing the dose distribution for CB and target using conventional treatment technique (upper panel), IMRT (middle panel) and RapidArc (lower panel).
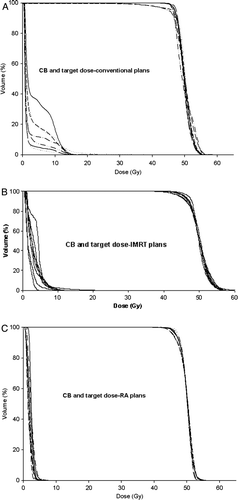
Table II. Mean dose to CB and ERR calculated using the linear and non-linear models for the 8 patients using standard conventional treatment technique, IMRT and volumetric modulated arc techniques. The mean CB dose is used to predict the risk for radiation induced malignancy in CB using the linear model. Calculations applying the non-linear model are based on the patients’ individual dose volume histogram and assuming α1=0.002Gy−1, α2=0.25Gy−1 and both α1/β1=α2/β2=4Gy.
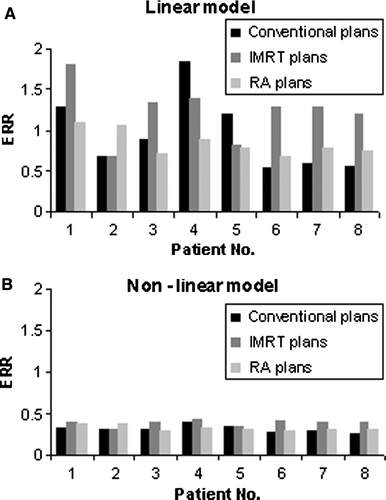
Figure 2. ERR predicted by linear and non linear models for radiation induced malignancy in CB for three different techniques in 8 included patients is shown in upper and lower panels, respectively.