Figures & data
Table 1. Mean temperature in five Nordic capitals in the years 1961–1990 Citation[10].
Figure 1. Population in the Nordic countries in 1890–2005, in millions Citation[12].
![Figure 1. Population in the Nordic countries in 1890–2005, in millions Citation[12].](/cms/asset/9d96587d-c42b-4d27-97d6-b62163754f9a/ionc_a_391526_f0001_b.jpg)
Figure 2. Number of immigrants to the Nordic countries Citation[13].
![Figure 2. Number of immigrants to the Nordic countries Citation[13].](/cms/asset/9c3c7b1d-5a89-4b30-b255-a63f66202400/ionc_a_391526_f0002_b.jpg)
Figure 3. CO2 emission in tons per capita in the Nordic countries in 2004 Citation[20].
![Figure 3. CO2 emission in tons per capita in the Nordic countries in 2004 Citation[20].](/cms/asset/c054009a-00ca-49de-bb5a-e4cc0b4f9ec9/ionc_a_391526_f0003_b.jpg)
Table 2. Food consumption (kg per person) in 1990 in the Nordic countries Citation[25].
Figure 4. Alcohol consumption in litres of pure alcohol in the Nordic countries Citation[26].
![Figure 4. Alcohol consumption in litres of pure alcohol in the Nordic countries Citation[26].](/cms/asset/a76a3885-2aa7-4247-a9e3-0597d4f37284/ionc_a_391526_f0004_b.jpg)
Figure 5. Drinking habits in 1965 and 1985 in the Nordic countries. By gender Citation[27].
![Figure 5. Drinking habits in 1965 and 1985 in the Nordic countries. By gender Citation[27].](/cms/asset/7c4297ba-49f6-4926-b729-6ea895953ea3/ionc_a_391526_f0005_b.jpg)
Figure 6. Proportion of daily smokers in the Nordic countries. Men and women Citation[14].
![Figure 6. Proportion of daily smokers in the Nordic countries. Men and women Citation[14].](/cms/asset/4496275c-f765-4dd5-b636-4d37252a8715/ionc_a_391526_f0006_b.jpg)
Figure 7. Smoking habits in 1965 and 1985 in the Nordic countries. By gender Citation[33].
![Figure 7. Smoking habits in 1965 and 1985 in the Nordic countries. By gender Citation[33].](/cms/asset/f8475bd0-682f-4a77-a648-179e378109e3/ionc_a_391526_f0007_b.jpg)
Table 3. Life expectancy at birth (in years) in the Nordic countries 1960 and 2005 Citation[14].
Figure 8. Infant mortality per 1 000 live births in the Nordic countries in 1960–2004 Citation[37].
![Figure 8. Infant mortality per 1 000 live births in the Nordic countries in 1960–2004 Citation[37].](/cms/asset/9712fe8a-af88-4e99-9f5a-5810aa4c7611/ionc_a_391526_f0008_b.jpg)
Figure 9. Proportion of work force by sector in the Nordic countries, both genders combined Citation[12],Citation[38],Citation[39].
![Figure 9. Proportion of work force by sector in the Nordic countries, both genders combined Citation[12],Citation[38],Citation[39].](/cms/asset/120ef697-b0a3-4fc9-a1f4-57a10ec9e062/ionc_a_391526_f0009_b.jpg)
Figure 10. Percentage of economically active women in the Nordic countries Citation[40].
![Figure 10. Percentage of economically active women in the Nordic countries Citation[40].](/cms/asset/da666d64-8702-4d85-80af-2a4971e83865/ionc_a_391526_f0010_b.jpg)
Figure 11. Time windows of follow-up of the study cohort defined by year of birth and age, by country. Bold vertical lines indicate time of baseline census used for allocation of the occupational category.
Figure 12. Age standardised (World) incidence rates for lip cancer 1943–2005, by country and gender. Modified from NORDCAN Citation[49].
![Figure 12. Age standardised (World) incidence rates for lip cancer 1943–2005, by country and gender. Modified from NORDCAN Citation[49].](/cms/asset/5576bd14-018d-49f2-a4c1-7082cf0479af/ionc_a_391526_f0012_b.jpg)
Table 4. Observed number of lip cancer among men in the Nordic countries and standardised incidence ratios 1961–2005, by country and occupational category.
Table 5. Observed number of lip cancer among women in the Nordic countries and standardised incidence ratios 1961–2005, by country and occupational category.
Figure 13. Age standardised (World) incidence rates for cancer of the tongue 1943–2005, by country and gender. Modified from NORDCAN Citation[49].
![Figure 13. Age standardised (World) incidence rates for cancer of the tongue 1943–2005, by country and gender. Modified from NORDCAN Citation[49].](/cms/asset/6c09d6cd-0d6b-4bd5-a489-7c84f3597ec2/ionc_a_391526_f0013_b.jpg)
Table 6. Observed number of cancer of the tongue among men in the Nordic countries and standardised incidence ratios 1961–2005, by country and occupational category.
Table 7. Observed number of cancer of the tongue among women in the Nordic countries and standardised incidence ratios 1961–2005, by country and occupational category.
Figure 14. Age standardised (World) incidence rates for cancer of the salivary glands 1943–2005, by country and gender. Modified from NORDCAN Citation[49].
![Figure 14. Age standardised (World) incidence rates for cancer of the salivary glands 1943–2005, by country and gender. Modified from NORDCAN Citation[49].](/cms/asset/1a025c09-7537-4e21-a4f9-d621d79a2f7d/ionc_a_391526_f0014_b.jpg)
Table 8. Observed number of cancer of the salivary glands among men in the Nordic countries and standardised incidence ratios 1961–2005, by country and occupational category.
Table 9. Observed number of cancer of the salivary glands among women in the Nordic countries and standardised incidence ratios 1961–2005, by country and occupational category.
Figure 15. Age standardised (World) incidence rates for cancer of the oral cavity 1943–2005, by country and gender. Modified from NORDCAN Citation[49].
![Figure 15. Age standardised (World) incidence rates for cancer of the oral cavity 1943–2005, by country and gender. Modified from NORDCAN Citation[49].](/cms/asset/d05a9c38-95e8-41aa-9782-e7a4e5659aa9/ionc_a_391526_f0015_b.jpg)
Table 10. Observed number of cancer of the oral cavity among men in the Nordic countries and standardised incidence ratios 1961–2005, by country and occupational category.
Table 11. Observed number of cancer of the oral cavity among women in the Nordic countries and standardised incidence ratios 1961–2005, by country and occupational category.
Figure 16. Age standardised (World) incidence rates for cancer of the pharynx 1943–2005, by country and gender. Modified from NORDCAN Citation[49].
![Figure 16. Age standardised (World) incidence rates for cancer of the pharynx 1943–2005, by country and gender. Modified from NORDCAN Citation[49].](/cms/asset/2610c704-3fda-41a9-9d89-e13bc137f0cf/ionc_a_391526_f0016_b.jpg)
Table 12. Observed number of cancer of the pharynx among men in the Nordic countries and standardised incidence ratios 1961–2005, by country and occupational category.
Table 13. Observed number of cancer of the pharynx among women in the Nordic countries and standardised incidence ratios 1961–2005, by country and occupational category.
Figure 17. Age standardised (World) incidence rates for oesophageal cancer 1943–2005, by country and gender. Modified from NORDCAN Citation[49].
![Figure 17. Age standardised (World) incidence rates for oesophageal cancer 1943–2005, by country and gender. Modified from NORDCAN Citation[49].](/cms/asset/3b870a0e-ecdc-4071-91c3-b39bdd2e9d37/ionc_a_391526_f0017_b.jpg)
Table 14. Observed number of oesophageal cancer among men in the Nordic countries and standardised incidence ratios 1961–2005, by country and occupational category.
Table 15. Observed number of oesophageal cancer among women in the Nordic countries and standardised incidence ratios 1961–2005, by country and occupational category.
Figure 18. Age standardised (World) incidence rates for stomach cancer 1943–2005, by country and gender. Modified from NORDCAN Citation[49].
![Figure 18. Age standardised (World) incidence rates for stomach cancer 1943–2005, by country and gender. Modified from NORDCAN Citation[49].](/cms/asset/61857704-9569-4da9-8e38-b3d2d201791c/ionc_a_391526_f0018_b.jpg)
Table 16. Observed number of stomach cancer among men in the Nordic countries and standardised incidence ratios 1961–2005, by country and occupational category.
Table 17. Observed number of stomach cancer among women in the Nordic countries and standardised incidence ratios 1961–2005, by country and occupational category.
Figure 19. Age standardised (World) incidence rates for cancer of the small intestine 1943–2005, by country and gender. Modified from NORDCAN Citation[49].
![Figure 19. Age standardised (World) incidence rates for cancer of the small intestine 1943–2005, by country and gender. Modified from NORDCAN Citation[49].](/cms/asset/bc983fae-55f0-4731-b4c1-42de1991da55/ionc_a_391526_f0019_b.jpg)
Table 18. Observed number of cancer of the small intestine among men in the Nordic countries and standardised incidence ratios 1961–2005, by country and occupational category.
Table 19. Observed number of cancer of the small intestine among women in the Nordic countries and standardised incidence ratios 1961–2005, by country and occupational category.
Figure 20. Age standardised (World) incidence rates for colon cancer 1943–2005, by country and gender. Modified from NORDCAN Citation[49].
![Figure 20. Age standardised (World) incidence rates for colon cancer 1943–2005, by country and gender. Modified from NORDCAN Citation[49].](/cms/asset/065935cb-2ae2-4f75-a824-8dd44da5a1dc/ionc_a_391526_f0020_b.jpg)
Table 20. Observed number of colon cancer among men in the Nordic countries and standardised incidence ratios 1961–2005, by country and occupational category.
Table 21. Observed number of colon cancer among women in the Nordic countries and standardised incidence ratios 1961–2005, by country and occupational category.
Figure 21. Age standardised (World) incidence rates for rectal cancer 1943–2005, by country and gender. Modified from NORDCAN Citation[49].
![Figure 21. Age standardised (World) incidence rates for rectal cancer 1943–2005, by country and gender. Modified from NORDCAN Citation[49].](/cms/asset/6d9c39b2-3e70-4b4a-a2de-556b6e43c170/ionc_a_391526_f0021_b.jpg)
Table 22. Observed number of rectal cancer among men in the Nordic countries and standardised incidence ratios 1961–2005, by country and occupational category.
Table 23. Observed number of rectal cancer among women in the Nordic countries and standardised incidence ratios 1961–2005, by country and occupational category.
Figure 22. Age standardised (World) incidence rates for liver cancer 1943–2005, by country and gender. Modified from NORDCAN Citation[49].
![Figure 22. Age standardised (World) incidence rates for liver cancer 1943–2005, by country and gender. Modified from NORDCAN Citation[49].](/cms/asset/c91c7e2d-de06-48e4-9230-0679c0c43715/ionc_a_391526_f0022_b.jpg)
Table 24. Observed number of liver cancer among men in the Nordic countries and standardised incidence ratios 1961–2005, by country and occupational category.
Table 25. Observed number of liver cancer among women in the Nordic countries and standardised incidence ratios 1961–2005, by country and occupational category.
Figure 23. Age standardised (World) incidence rates for cancer of the gallbladder 1943–2005, by country and gender. Modified from NORDCAN Citation[49].
![Figure 23. Age standardised (World) incidence rates for cancer of the gallbladder 1943–2005, by country and gender. Modified from NORDCAN Citation[49].](/cms/asset/e126334b-c075-466f-8733-a64a1949c74b/ionc_a_391526_f0023_b.jpg)
Table 26. Observed number of cancer of the gallbladder among men in the Nordic countries and standardised incidence ratios 1961–2005, by country and occupational category.
Table 27. Observed number of cancer of the gallbladder among women in the Nordic countries and standardised incidence ratios 1961–2005, by country and occupational category.
Figure 24. Age standardised (World) incidence rates for pancreatic cancer 1943–2005, by country and gender. Modified from NORDCAN Citation[49].
![Figure 24. Age standardised (World) incidence rates for pancreatic cancer 1943–2005, by country and gender. Modified from NORDCAN Citation[49].](/cms/asset/2ea120f2-ca6d-4c25-81d6-bbbffa991b4e/ionc_a_391526_f0024_b.jpg)
Table 28. Observed number of pancreatic cancer among men in the Nordic countries and standardised incidence ratios 1961–2005, by country and occupational category.
Table 29. Observed number of pancreatic cancer among women in the Nordic countries and standardised incidence ratios 1961–2005, by country and occupational category.
Figure 25. Age standardised (World) incidence rates for nasal cancer 1943–2005, by country and gender. Modified from NORDCAN Citation[49].
![Figure 25. Age standardised (World) incidence rates for nasal cancer 1943–2005, by country and gender. Modified from NORDCAN Citation[49].](/cms/asset/44c8a2b5-61ae-4340-b35e-d5c8ad182f55/ionc_a_391526_f0025_b.jpg)
Table 30. Observed number of nasal cancer among men in the Nordic countries and standardised incidence ratios 1961—2005, by country and occupational category.
Table 31. Observed number of nasal cancer among women in the Nordic countries and standardised incidence ratios 1961–2005, by country and occupational category.
Figure 26. Age standardised (World) incidence rates for laryngeal cancer 1943–2005, by country and gender. Modified from NORDCAN Citation[49].
![Figure 26. Age standardised (World) incidence rates for laryngeal cancer 1943–2005, by country and gender. Modified from NORDCAN Citation[49].](/cms/asset/19d872a5-2c08-4ce5-b699-aef82fc5466e/ionc_a_391526_f0026_b.jpg)
Table 32. Observed number of laryngeal cancer among men in the Nordic countries and standardised incidence ratios1961–2005, by country and occupational category.
Table 33. Observed number of laryngeal cancer among women in the Nordic countries and standardised incidence ratios 1961–2005, by country and occupational category.
Figure 27. Age standardised (World) incidence rates for lung cancer 1943–2005, by country and gender. Modified from NORDCAN Citation[49].
![Figure 27. Age standardised (World) incidence rates for lung cancer 1943–2005, by country and gender. Modified from NORDCAN Citation[49].](/cms/asset/add067fa-5d9e-4fa2-8ea7-a11cbb44b7ce/ionc_a_391526_f0027_b.jpg)
Table 34. Observed number of lung cancer among men in the Nordic countries and standardised incidence ratios 1961–2005, by country and occupational category.
Table 35. Observed number of lung cancer among women in the Nordic countries and standardised incidence ratios 1961–2005, by country and occupational category.
Table 36. Standardised incidence ratio for histological subtypes of lung cancer, 1961–2005, by gender and occupational category. Only occupations with more than 30 observed cases in sum are listed.
Figure 28. Age standardised (World) incidence rates for pleural cancer 1943–2005, by country and gender. Modified from NORDCAN Citation[49].
![Figure 28. Age standardised (World) incidence rates for pleural cancer 1943–2005, by country and gender. Modified from NORDCAN Citation[49].](/cms/asset/cc64d951-c263-4f87-89d5-aa61ca2daecd/ionc_a_391526_f0028_b.jpg)
Table 37. Observed number of mesothelioma in the pleura/peritoneum among men in the Nordic countries and standardised incidence ratios 1961–2005, by country and occupational category.
Table 38. Observed number of mesothelioma in the pleura/peritoneum among women in the Nordic countries and standardised incidence ratios 1961–2005, by country and occupational category.
Figure 29. Age standardised (World) incidence rates for breast cancer 1943–2005, by country. Modified from NORDCAN Citation[49].
![Figure 29. Age standardised (World) incidence rates for breast cancer 1943–2005, by country. Modified from NORDCAN Citation[49].](/cms/asset/602cd1ff-c4d6-47d9-a6b7-c9eac1c327cc/ionc_a_391526_f0029_b.jpg)
Table 39. Observed number of breast cancer among men in the Nordic countries and standardised incidence ratios 1961–2005, by country and occupational category.
Table 40. Observed number of breast cancer among women in the Nordic countries and standardised incidence ratios 1961–2005, by country and occupational category.
Figure 30. Age standardised (World) incidence rates for cancer of the cervix uteri 1943–2005, by country. Modified from NORDCAN Citation[49].
![Figure 30. Age standardised (World) incidence rates for cancer of the cervix uteri 1943–2005, by country. Modified from NORDCAN Citation[49].](/cms/asset/4fe47100-d6bf-47d3-8052-c6c41e80148a/ionc_a_391526_f0030_b.jpg)
Table 41. Observed number of cancer of the cervix uteri among women in the Nordic countries and standardised incidence ratios 1961–2005, by country and occupational category.
Figure 31. Age standardised (World) incidence rates for cancer of the corpus uteri 1943–2005, by country. Modified from NORDCAN Citation[49].
![Figure 31. Age standardised (World) incidence rates for cancer of the corpus uteri 1943–2005, by country. Modified from NORDCAN Citation[49].](/cms/asset/b8abf38d-eb49-45ea-9e24-84e48aa22bec/ionc_a_391526_f0031_b.jpg)
Table 42. Observed number of cancer of the corpus uteri among women in the Nordic countries and standardised incidence ratios 1961–2005, by country and occupational category.
Figure 32. Age standardised (World) incidence rates for ovarian cancer 1943–2005, by country. Modified from NORDCAN Citation[49].
![Figure 32. Age standardised (World) incidence rates for ovarian cancer 1943–2005, by country. Modified from NORDCAN Citation[49].](/cms/asset/17d99378-391e-4282-8c80-f42304171387/ionc_a_391526_f0032_b.jpg)
Table 43. Observed number of ovarian cancer among women in the Nordic countries and standardised incidence ratios 1961–2005, by country and occupational category.
Table 44. Observed number of cancer of the fallopian tube among women in the Nordic countries and standardised incidence ratios 1961–2005, by country and occupational category.
Table 45. Observed number of cancer of the vulva among women in the Nordic countries and standardised incidence ratios 1961–2005, by country and occupational category.
Table 46. Observed number of vaginal cancer among women in the Nordic countries and standardised incidence ratios 1961–2005, by country and occupational category.
Figure 33. Age standardised (World) incidence rates for prostate cancer 1943–2005, by country. Modified from NORDCAN Citation[49].
![Figure 33. Age standardised (World) incidence rates for prostate cancer 1943–2005, by country. Modified from NORDCAN Citation[49].](/cms/asset/8a244e33-7235-4696-92bc-8fd219205644/ionc_a_391526_f0033_b.jpg)
Table 47. Observed number of prostate cancer among men in the Nordic countries and standardised incidence ratios 1961–2005, by country and occupational category.
Figure 34. Age standardised (World) incidence rates for testicular cancer 1943–2005, by country. Modified from NORDCAN Citation[49].
![Figure 34. Age standardised (World) incidence rates for testicular cancer 1943–2005, by country. Modified from NORDCAN Citation[49].](/cms/asset/d8b471c4-be2e-4094-b50d-e83aeb91b064/ionc_a_391526_f0034_b.jpg)
Table 48. Observed number of testicular cancer among men in the Nordic countries and standardised incidence ratios 1961–2005, by country and occupational category.
Figure 35. Age standardised (World) incidence rates for cancer of the other male genitals 1943–2005, by country. Modified from NORDCAN Citation[49].
![Figure 35. Age standardised (World) incidence rates for cancer of the other male genitals 1943–2005, by country. Modified from NORDCAN Citation[49].](/cms/asset/09d5d061-94ae-4e1f-9ea0-5f6196b241aa/ionc_a_391526_f0035_b.jpg)
Table 49. Observed number of cancer of the penis among men in the Nordic countries and standardised incidence ratios 1961–2005, by country and occupational category.
Figure 36. Age standardised (World) incidence rates for kidney cancer 1943–2005, by country and gender. Modified from NORDCAN Citation[49].
![Figure 36. Age standardised (World) incidence rates for kidney cancer 1943–2005, by country and gender. Modified from NORDCAN Citation[49].](/cms/asset/4160cdfa-8782-49c4-add5-92d1d964e35e/ionc_a_391526_f0036_b.jpg)
Table 50. Observed number of kidney cancer among men in the Nordic countries and standardised incidence ratios 1961–2005, by country and occupational category.
Table 51. Observed number of kidney cancer among women in the Nordic countries and standardised incidence ratios 1961–2005, by country and occupational category.
Table 52. Observed number of cancer of the bladder, ureter, and urethra among men in the Nordic countries and standardised incidence ratios 1961–2005, by country and occupational category.
Table 53. Observed number of cancer of the bladder, ureter, and urethra among women in the Nordic countries and standardised incidence ratios 1961–2005, by country and occupational category.
Figure 37. Age standardised (World) incidence rates for cancer of the bladder, ureter and urethra 1943–2005, by country and gender. Modified from NORDCAN Citation[49].
![Figure 37. Age standardised (World) incidence rates for cancer of the bladder, ureter and urethra 1943–2005, by country and gender. Modified from NORDCAN Citation[49].](/cms/asset/b5c23f93-1816-4426-8b6b-0face5c1bc23/ionc_a_391526_f0037_b.jpg)
Figure 38. Age standardised (World) incidence rates for malignant melanoma of the skin 1943–2005, by country and gender. Modified from NORDCAN Citation[49].
![Figure 38. Age standardised (World) incidence rates for malignant melanoma of the skin 1943–2005, by country and gender. Modified from NORDCAN Citation[49].](/cms/asset/fad6a7e1-9eba-4801-bacf-5ba515a35353/ionc_a_391526_f0038_b.jpg)
Table 54. Observed number of skin melanoma among men in the Nordic countries and standardised incidence ratios 1961–2005, by country and occupational category.
Table 55. Observed number of skin melanoma among women in the Nordic countries and standardised incidence ratios 1961–2005, by country and occupational category.
Table 56. Observed number of non–melanoma skin cancer among men in the Nordic countries and standardised incidence ratios 1961–2005, by country and occupational category.
Table 57. Observed number of non–melanoma skin cancer among women in the Nordic countries and standardised incidence ratios 1961–2005, by country and occupational category.
Figure 39. Age standardised (World) incidence rates for non-melanoma skin cancer 1943–2005, by country and gender. Modified from NORDCAN Citation[49].
![Figure 39. Age standardised (World) incidence rates for non-melanoma skin cancer 1943–2005, by country and gender. Modified from NORDCAN Citation[49].](/cms/asset/5bdaebea-db76-4dd2-920e-cf48b5bdb7bd/ionc_a_391526_f0039_b.jpg)
Figure 40. Age standardised (World) incidence rates for eye cancer 1943–2005, by country and gender. Modified from NORDCAN Citation[49].
![Figure 40. Age standardised (World) incidence rates for eye cancer 1943–2005, by country and gender. Modified from NORDCAN Citation[49].](/cms/asset/50068bd9-af88-4029-b29c-2822b2095ba4/ionc_a_391526_f0040_b.jpg)
Table 58. Observed number of eye cancer among men in the Nordic countries and standardised incidence ratios 1961–2005, by country and occupational category.
Table 59. Observed number of eye cancer among women in the Nordic countries and standardised incidence ratios 1961–2005, by country and occupational category.
Figure 41. Age standardised (World) incidence rates for brain cancer 1943–2005, by country and gender. Modified from NORDCAN Citation[49].
![Figure 41. Age standardised (World) incidence rates for brain cancer 1943–2005, by country and gender. Modified from NORDCAN Citation[49].](/cms/asset/1822790d-668f-4827-b9f8-135a3281b61c/ionc_a_391526_f0041_b.jpg)
Table 60. Observed number of brain cancer among men in the Nordic countries and standardised incidence ratios 1961–2005, by country and occupational category.
Table 61. Observed number of brain cancer among women in the Nordic countries and standardised incidence ratios 1961–2005, by country and occupational category.
Figure 42. Age standardised (World) incidence rates for thyroid cancer 1943–2005, by country and gender. Modified from NORDCAN Citation[49].
![Figure 42. Age standardised (World) incidence rates for thyroid cancer 1943–2005, by country and gender. Modified from NORDCAN Citation[49].](/cms/asset/7cddaea9-5122-4b4e-ad98-93c669c4e658/ionc_a_391526_f0042_b.jpg)
Table 62. Observed number of thyroid cancer among men in the Nordic countries and standardised incidence ratios 1961–2005, by country and occupational category.
Table 63. Observed number of thyroid cancer among women in the Nordic countries and standardised incidence ratios 1961–2005, by country and occupational category.
Figure 43. Age standardised (World) incidence rates for bone cancer 1943–2005, by country and gender. Modified from NORDCAN Citation[49].
![Figure 43. Age standardised (World) incidence rates for bone cancer 1943–2005, by country and gender. Modified from NORDCAN Citation[49].](/cms/asset/04f22d02-d79a-4128-9c1d-9ceb594a340e/ionc_a_391526_f0043_b.jpg)
Table 64. Observed number of bone cancer among men in the Nordic countries and standardised incidence ratios 1961–2005, by country and occupational category.
Table 65. Observed number of bone cancer among women in the Nordic countries and standardised incidence ratios 1961–2005, by country and occupational category.
Figure 44. Age standardised (World) incidence rates for soft tissue cancer 1943–2005, by country and gender. Modified from NORDCAN Citation[49].
![Figure 44. Age standardised (World) incidence rates for soft tissue cancer 1943–2005, by country and gender. Modified from NORDCAN Citation[49].](/cms/asset/f76473b3-3e09-4b03-a15f-91c86dda178d/ionc_a_391526_f0044_b.jpg)
Table 66. Observed number of soft tissue cancer among men in the Nordic countries and standardised incidence ratios 1961–2005, by country and occupational category.
Table 67. Observed number of soft tissue cancer among women in the Nordic countries and standardised incidence ratios 1961–2005, by country and occupational category.
Figure 45. Age standardised (World) incidence rates for non-Hodgkin lymphoma 1943–2005, by country and gender. Modified from NORDCAN Citation[49].
![Figure 45. Age standardised (World) incidence rates for non-Hodgkin lymphoma 1943–2005, by country and gender. Modified from NORDCAN Citation[49].](/cms/asset/2f86b3f6-020b-4e9a-bb51-ab61fefdcf70/ionc_a_391526_f0045_b.jpg)
Table 68. Observed number of other/unknown site among men in the Nordic countries and standardised incidence ratios 1961–2005, by country and occupational category.
Table 69. Observed number of other/unknown site among women in the Nordic countries and standardised incidence ratios 1961–2005, by country and occupational category.
Figure 46. Age standardised (World) incidence rates for Hodgkin lymphoma 1943–2005, by country and gender. Modified from NORDCAN Citation[49].
![Figure 46. Age standardised (World) incidence rates for Hodgkin lymphoma 1943–2005, by country and gender. Modified from NORDCAN Citation[49].](/cms/asset/1bb97000-f886-45ef-94dd-36cc917dcf22/ionc_a_391526_f0046_b.jpg)
Table 70. Observed number of non-Hodgkin lymphoma among men in the Nordic countries and standardised incidence ratios 1961–2005, by country and occupational category.
Table 71. Observed number of non-Hodgkin lymphoma among women in the Nordic countries and standardised incidence ratios 1961–2005, by country and occupational category.
Figure 47. Age standardised (World) incidence rates for multiple myeloma 1943–2005, by country and gender. Modified from NORDCAN Citation[49].
![Figure 47. Age standardised (World) incidence rates for multiple myeloma 1943–2005, by country and gender. Modified from NORDCAN Citation[49].](/cms/asset/f6f66bf0-3372-4397-9204-89154d7c4d66/ionc_a_391526_f0047_b.jpg)
Table 72. Observed number of Hodgkin lymphoma among men in the Nordic countries and standardised incidence ratios 1961–2005, by country and occupational category.
Table 73. Observed number of Hodgkin lymphoma among women in the Nordic countries and standardised incidence ratios 1961–2005, by country and occupational category.
Figure 48. Age standardised (World) incidence rates for leukaemia 1943–2005, by country and gender. Modified from NORDCAN Citation[49].
![Figure 48. Age standardised (World) incidence rates for leukaemia 1943–2005, by country and gender. Modified from NORDCAN Citation[49].](/cms/asset/2b5e4748-97e1-4d4b-a73d-e70a652e5460/ionc_a_391526_f0048_b.jpg)
Table 74. Observed number of multiple myeloma among men in the Nordic countries and standardised incidence ratios 1961–2005, by country and occupational category.
Table 75. Observed number of multiple myeloma among women in the Nordic countries and standardised incidence ratios 1961–2005, by country and occupational category.
Table 76. Observed number of leukaemia among men in the Nordic countries and standardised incidence ratios 1961–2005, by country and occupational category.
Table 77. Observed number of leukaemia among women in the Nordic countries and standardised incidence ratios 1961–2005, by country and occupational category.
Table 78. Observed number of mycosis fungoides among men in the Nordic countries and standardised incidence ratios 1961–2005, by country and occupational category.
Table 79. Observed number of mycosis fungoides among women in the Nordic countries and standardised incidence ratios 1961–2005, by country and occupational category.
Figure 49. Age standardised (World) incidence rates for all malignant neoplasms 1943–2005, by country and gender. Modified from NORDCAN Citation[49].
![Figure 49. Age standardised (World) incidence rates for all malignant neoplasms 1943–2005, by country and gender. Modified from NORDCAN Citation[49].](/cms/asset/5c722f43-fa38-4022-a1f6-a4437526e327/ionc_a_391526_f0049_b.jpg)
Table 80. Observed number of all malignant neoplasms among men in the Nordic countries and standardised incidence ratios 1961–2005, by country and occupational category.
Table 81. Observed number of all malignant neoplasms among women in the Nordic countries and standardised incidence ratios 1961–2005, by country and occupational category.
Table 82. Number of persons and proportion who stayed in their occupation between censuses, Finland 1970–1980 census, Norway and Sweden 1960–1970 census, by gender and occupational category. Only occupations N > 10 are included.
Table 83. Standardized incidence ratios for testis cancer based on country specific incidence rates (SIRc) and Nordic incidence rates (SIRn), by occupational category. Only occupations where sum of observed cases ≥20 in Denmark and Finland are included.
Figure 50. Age adjusted (World) incidence rates of cancer (all sites) in the Nordic countries in 1998–2003, by gender, based on municipality specific observations Citation[167].
![Figure 50. Age adjusted (World) incidence rates of cancer (all sites) in the Nordic countries in 1998–2003, by gender, based on municipality specific observations Citation[167].](/cms/asset/c81d17ba-73b2-4e5e-8187-04238cd003f6/ionc_a_391526_f0050_b.jpg)
Table 84. Estimated proportion of current smokers in the Norwegian study populaton (1965–1981), by occupational category. Only groups >10 are included [83].
Table 85. Original SIR and smoking adjusted lung cancer SIR by occupation among 893 264 Norwegian men followed-up 1971–1991 [83].
Table 86. Observed number (Obs) of incident cases of alcohol related cancer (alcohol cancers) and number of deaths from alcohol related non-malignant liver disease (liver disease) and standardised incidence/mortality ratio (SIR/SMR) for the Nordic countries, 1961–2005, by gender and occupational category.
Table 87. Parity for the Norwegian women in the study. Only women born 1935–1950 are included.
Figure 51. Risk of cancer in occupations with the highest and lowest standardised incidence ratios (SIR), by gender. Only occupations with ≥ 1 000 workers, ≥5 observed cases and ≥5 expected cases have been included.
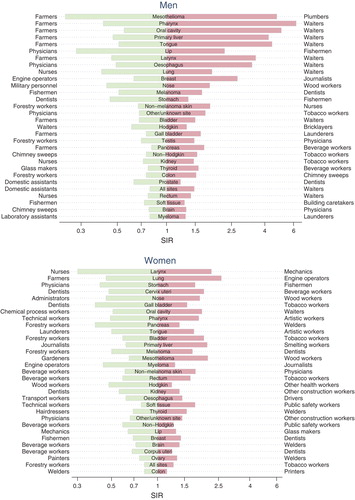
Figure 52. Standardised incidence ratios (SIR) and 95% confidence interval for selected cancers among farmers and waiters, by gender.
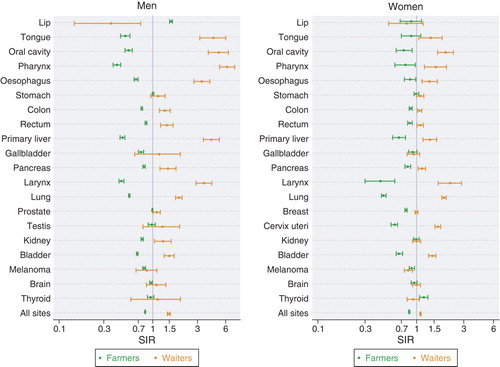
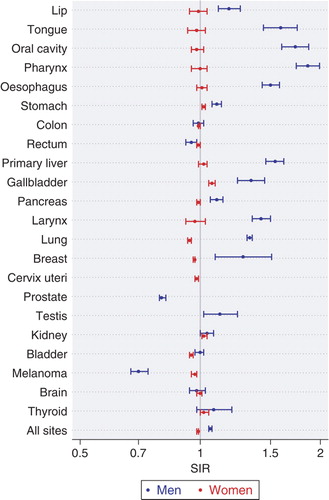
Figure 53. Standardised incidence ratios (SIR) and 95% confidence intervals for selected cancers among economically inactive men and women.
Appendix 1. Abbreviations of the occupational categories defined by NYK-codes and ISCO-1958 codes.
Appendix 2. Description of the occupational categories.
Appendix 3. Number of persons under follow-up by gender, country and occupational category.
Appendix 4. Number of persons-years under follow-up by gender, country and occupational category.
Appendix 5. Number of new cancer cases during the follow-up period, by country. Men.
Appendix 6. Number of new cancer cases during the follow-up period, by country. Women.
Table of contents: Occupation and cancer – follow-up of 15 million people in five Nordic countries