
Figures & data
Table 1. Clinical dose requirements (rigidly enforced for all plans).
Figure 1. Dose-volume histogram (DVH) comparison between treatment planning strategies (A)–(C) for all 10 rectum spacer patients. Each solid/dashed line corresponds to a DVH plot for an individual patient; the shaded regions indicate the inter-patient range for each plan type. (a) Plans with uniform 5mm CTV to PTV expansion; (b) plans with no CTV to PTV expansion.
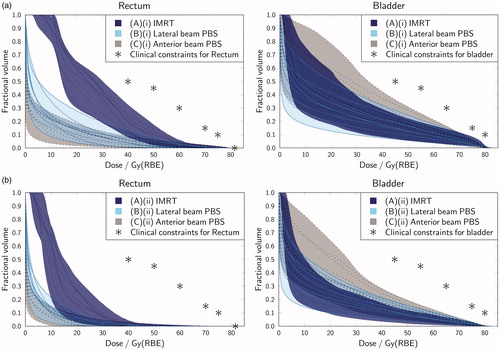
Figure 2. Demonstrations of variable RBE weighted (vRBEw) dose distributions for anterior-oblique spot-scanned proton therapy plans with a uniform 5 mm CTV to PTV margin. The planning target volume is contoured in black; the hydrogel, contoured using additional magnetic resonance data, is shown in blue; and the rectum is contoured in pink. The dose distributions overlaid here are for vRBEw dose calculated according to the McNamara model with an α/β of 3 Gy. (a) Sagittal view of case where spacer was least effective; (b) axial view of case where spacer was least effective; (c) sagittal view of more typical case; (d) axial view of more typical case.
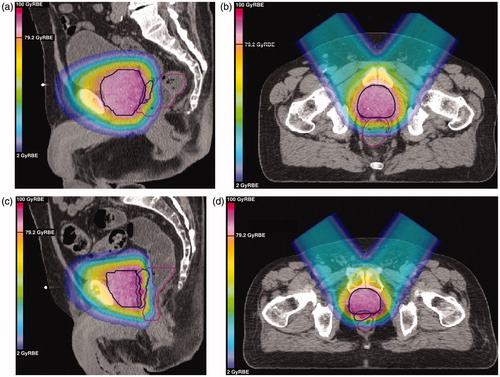
Figure 3. Investigating the McNamara model’s [Citation11] sensitivity to α/β value and fractionation regimen. (a) Plans with uniform 5 mm CTV to PTV expansion: boxplots of the maximum dose to 1cc of the rectum for all 10 patients. The horizontal line shows the constraint that no 1cc of the rectum should receive more than 103% of the prescription dose; (b) plans with uniform 5 mm CTV to PTV expansion: boxplots of the CTV equivalent uniform dose (EUD) for all 10 patients, assuming an EUD a-value of -10 [20]; (c) example application of the McNamara model for various fractionation schemes and α/β values for a simple proton SOBP in water, range = 20 cm, modulation = 10 cm; (d) considering the ratio (vRBEw dose with an α/β of 1.5 Gy)/(vRBEw dose with an α/β of 3 Gy) for the fractionation schemes shown in Figure 3(c).
![Figure 3. Investigating the McNamara model’s [Citation11] sensitivity to α/β value and fractionation regimen. (a) Plans with uniform 5 mm CTV to PTV expansion: boxplots of the maximum dose to 1cc of the rectum for all 10 patients. The horizontal line shows the constraint that no 1cc of the rectum should receive more than 103% of the prescription dose; (b) plans with uniform 5 mm CTV to PTV expansion: boxplots of the CTV equivalent uniform dose (EUD) for all 10 patients, assuming an EUD a-value of -10 [20]; (c) example application of the McNamara model for various fractionation schemes and α/β values for a simple proton SOBP in water, range = 20 cm, modulation = 10 cm; (d) considering the ratio (vRBEw dose with an α/β of 1.5 Gy)/(vRBEw dose with an α/β of 3 Gy) for the fractionation schemes shown in Figure 3(c).](/cms/asset/9eb2aa80-828a-4076-a845-15832e34a6f0/ionc_a_1275781_f0003_c.jpg)