
Figures & data
Table 1. Nordic cancer registries, administrative facts and quality issues. For questions on how to contact the Cancer Registry; how to apply information from the Cancer Registry (with links to forms and instructions); links to documents on data protection principles and to publications on data quality; please see the more detailed web version of this table.
Table 2. Data sources of the Nordic cancer registries (routine data collection).
Figure 1. Time trends of incidence of leukemia in men in four Nordic countries. Three-year floating averages of age-standardized rates (World) 1943–2104. In 1978, 18% of leukemia cases were missing from the Swedish Cancer Registry [Citation2]; the proportion now may be smaller.
![Figure 1. Time trends of incidence of leukemia in men in four Nordic countries. Three-year floating averages of age-standardized rates (World) 1943–2104. In 1978, 18% of leukemia cases were missing from the Swedish Cancer Registry [Citation2]; the proportion now may be smaller.](/cms/asset/a603d877-b5b7-4514-a513-eaa82521ba02/ionc_a_1407039_f0001_c.jpg)
Figure 2. Incidence of pancreatic cancer in men in in the Nordic countries in 2009–2013, by age. The proportion of malignancies detected via the Cause of Death Register is particularly high for cancers not diagnosed or treated in hospital, e.g., cancers with a poor prognosis in the elderly such as pancreatic cancer.
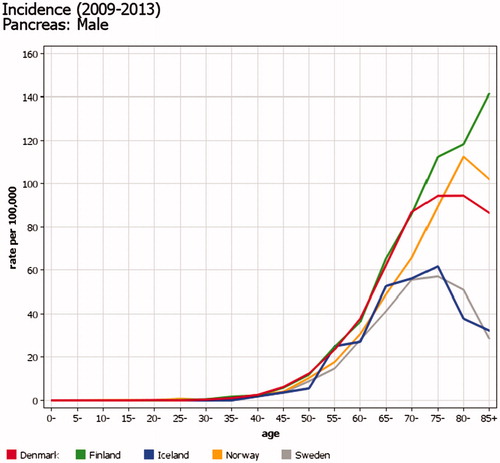
Table 3. Numbers of cancers and other disease entities collected by the Nordic cancer registries, 2009–2013.
Figure 3. Time trends of incidence of non-melanoma skin cancer in men in the Nordic countries as reported by NORDCAN. Age-standardized rates (World) 1943–2014. Before 1978, Danish Cancer Registry could not separate basal cell carcinoma from the other non-melanoma skin cancers.
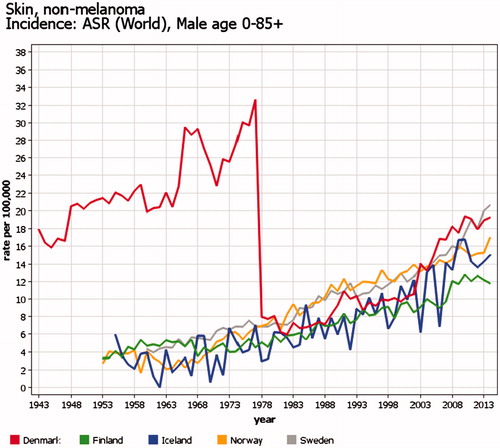
Figure 4. Time trends of incidence of bladder cancer in men in the Nordic countries. Five-year floating averages of age-standardized rates (World) 1943–2014. Part of the differences is explained by registration: Denmark has more often than the others included urothelial tumors of grades 1–4, unknown grade and ‘papilloma’ in the bladder in the incidence.
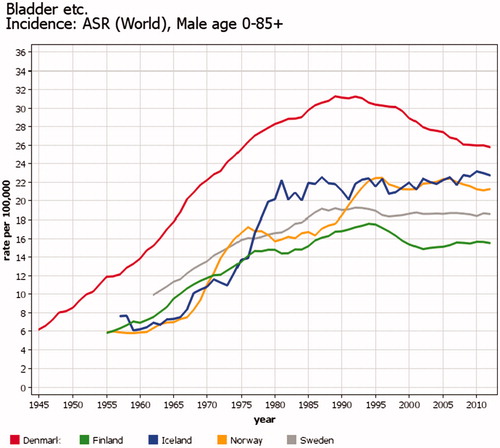
Figure 5. Time trends of incidence of prostate cancer in the Nordic countries. Age-standardized rates (World) 1943–2014. There was a steep increase in the incidence after global introduction of the PSA screening test in the early 1990s in all Nordic countries but in Denmark. In Denmark, the increase in incidence after 2004 partly reflects inclusion of pathology register information.
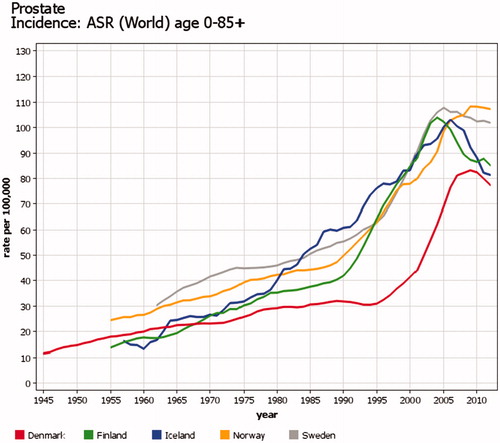
Figure 6. Geographical variation of incidence of thyroid cancer among women in the Nordic countries in 2004–2010 [Citation39]. The red area in mid Finland is consequence of excessive testing with ultrasound.
![Figure 6. Geographical variation of incidence of thyroid cancer among women in the Nordic countries in 2004–2010 [Citation39]. The red area in mid Finland is consequence of excessive testing with ultrasound.](/cms/asset/e0b6e322-7e3e-4359-80cf-d11eb4bfd6b1/ionc_a_1407039_f0006_c.jpg)
Figure 7. Time trends of cervical cancer in the Nordic countries in the screened age categories 30–69 years. Truncated age- standardized rates (World) 1943–2014. The downward trend in incidence started at different times depending on the start of national organized cervical cancer screening program.
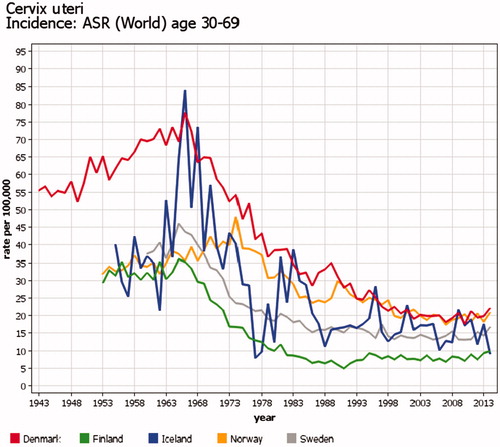
Figure 8. Time trends of female breast cancer in age 50–59 years in four Nordic countries. Truncated age- standardized rates (World) 1943–2014. Start of countrywide organized mammography screening varied from 1986 (Finland) to 2007–2009 (Denmark); this caused major increases in the incidence rates of the screened age category.
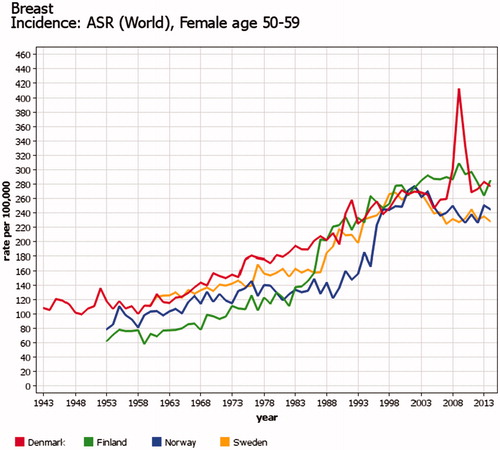
Figure 9. Time trends of incidence of basal cell carcinoma (BCC) among men in the Nordic countries in 1953–2015. Age-standardized rates (World), only the first BCC counted for each person. Registration practices of BCC – which has normally not been counted as true cancer in the routine statistics – have varied between countries and time periods.
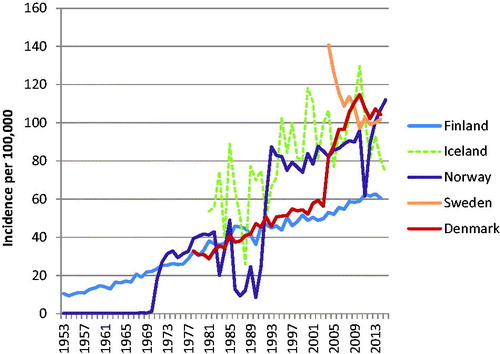
Table 4. Variables on cancer patients registered by the Nordic cancer registries.
Table 5. Variables related to each cancer registered by the Nordic cancer registries.