
Figures & data
Table 1. Tolerance dose and planning priority per organ at risk in Gy (RBE).
Figure 1. Example of a radiation treatment plans for a patient with a LGG parieto-occipitally in the left hemisphere. The CTV (pink), hippocampus (yellow) and dose distribution (ranging from low dose depicted in blue to high dose in red) are given for the VMAT (A), TOMO (B), IMRT (C) and IMPT (D) treatment plans, in the transverse (upper row), frontal (middle row) and sagittal (lower row) view. Of note is the large low-dose bath when using either of the photon techniques (A–C).
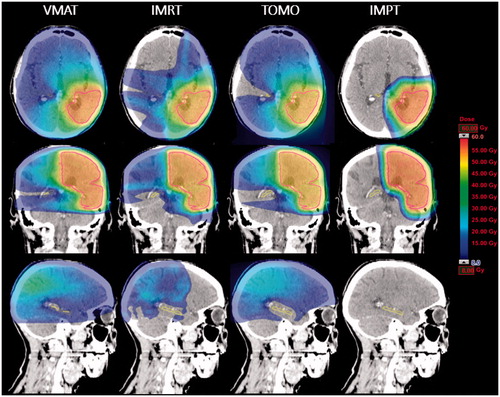
Table 2. Dose and coverage parameters per organ at risk or target volume per treatment modality (significance calculated in comparison to the gold standard VMAT).
Figure 2. Three-dimensional representations of the cerebrum and cerebellum of a LGG patient highlighting the CTV in red and the 20 Gy isodose (purple/brown) of the different treatment techniques studied (VMAT, TOMO, IMRT and IMPT).
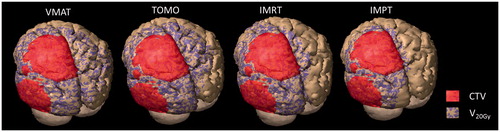
Figure 3. The percentage of organs at risk volume (related to cognition) receiving a radiation dose between 5 Gy and 50 Gy (V5 Gy to V50 Gy, respectively).
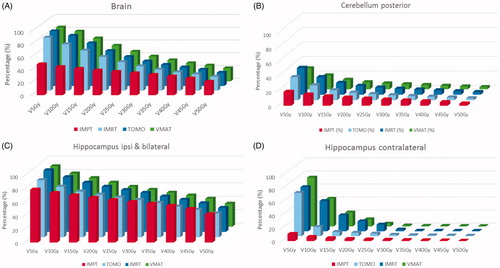
Table 3. Absolute percentage of the hippocampus, posterior cerebellum and brain volumes receiving a dose between 5 and 50 Gy (RBE) presented per treatment modality (statistical comparison versus the gold standard being VMAT).