Figures & data
Figure 1. Differentially expressed gene (DEG) analysis between HNSCC tumor and adjacent normal tissues. (A) Volcano plot for the differential expressed genes; (B) the heatmap represents the mRNA expression levels of 2101 DEGs in 43 of HNSCC tumor tissue and 43 of adjacent normal tissues; (C) GO and (D) KEGG enrichment analysis results of 1535 up-regulated genes; (E) GO and (F) KEGG enrichment analysis results of 566 down-regulated genes.
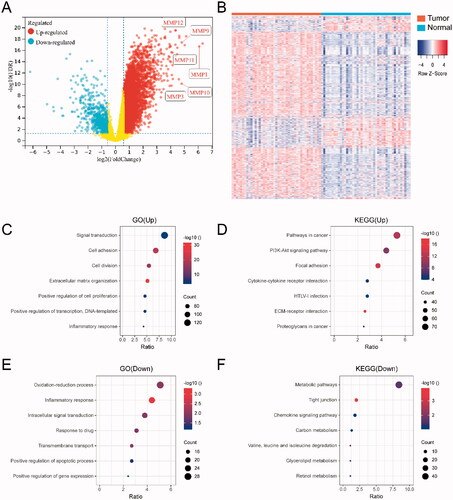
Figure 2. Expression patterns of MMPs/TIMPs in HNSCC. (A) The heatmap represents the mRNA expression levels of MMPs and TIMPs in 500 of HNSCC tumor tissue and 44 of adjacent normal tissues; correlations of expression of MMPs/TIMPs in (B) 500 of HNSCC tumor samples and (C) 44 of adjacent normal tissue samples; (D) the correlation of each gene combination of MMPs/TIMPs in HNSCC tumor samples and adjacent normal tissue samples; (E) principal component analysis of mRNA expression of MMPs/TIMPs in 500 of HNSCC tumor samples (orange circles) and 44 adjacent normal tissue samples (blue circles) showing clear separation of the groups.
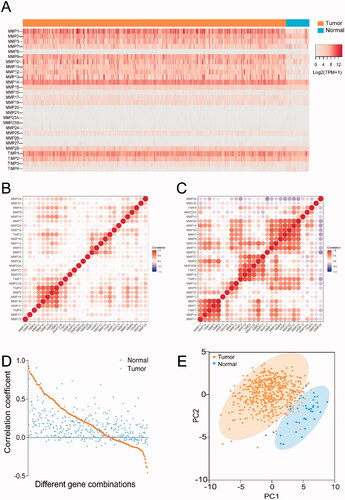
Figure 3. Genomic alteration analysis of MMPs/TIMPs in HNSCC using cBioPortal. (A) OncoPrint providing a visual summary of alteration across a set of 500 of HNSCC samples based on a query of the 28 of MMPs/TIMPs genes. Each row is taken as a gene, and each column is regarded as a sample. Bars of different colors represent different genomic alterations; (B) overall survival and (C) disease-free survival rates of the HNSCC patients with or without MMPs/TIMPs mutations. The red curves in the Kaplan–Meier plots include cases with gene alteration, and the blue curves include cases without gene alteration.
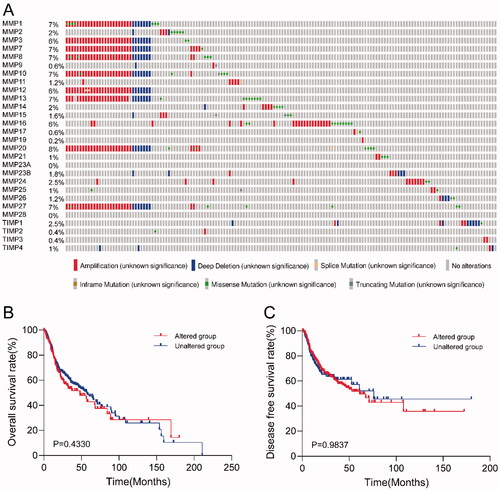
Figure 4. Construction of the prognostic risk prediction model based on the expression level of MMPs/TIMPs. (A) λ selection by 10-fold cross-validation. Continuous upright lines are partial likelihood deviance ± SE; dotted lines are depicted at the optimal values by minimum criteria (lambda.min, left vertical dotted line) and 1-SE criteria (lambda.1se, right vertical dotted line). The partial likelihood deviance with changing of log (λ) was plotted. The value was 0.02 chosen for λ by 10‑fold cross‑validation with the minimum criteria; (B) processes of LASSO Cox model fitting. Each curve represents a gene; (C) the distributions of the risk score and heatmap of eight mRNA expression profiles of HNSCC patients in training set, which are ranked by risk score; (D) Kaplan–Meier curve of overall survival probability for patients with HNSCC from training set divided into high- and low-risk groups based on the risk score of five-mRNA signature; (E) receiver operating characteristic curve (ROC) of the risk score for predicting 1-year, 3-year, and 5-year survival rate in training set; (F) Kaplan–Meier curve of overall survival probability for patients with HNSCC from validation set divided into high- and low-risk groups based on the risk score; (G) receiver operating characteristic curve (ROC) of the risk score for predicting 1-year, 3-year, and 5-year survival rate in validation set.
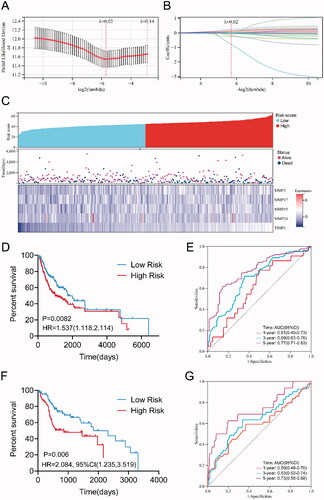
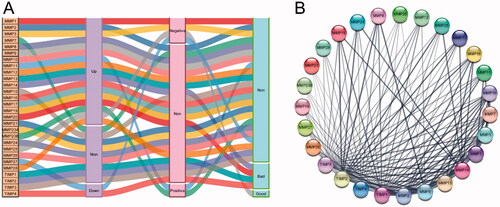
Figure 5. The summary of the effect of expression of MMPs/TIMPs on HNSCC progression. (A) Sankey diagram summarized the relation of each MMPs/TIMPs expression with HNSCC progression and prognosis; (B) protein–protein interaction network of 24 MMPs genes and 4 TIMPs.