
Figures & data
Figure 1. PRISMA flow diagram of Pentasa studies identified for inclusion in meta-analyses. *This included two Cochrane reviews of 5-ASAs in ulcerative colitisCitation17,Citation18, which met the inclusion criteria, but did not contain information on any further Pentasa studies not already identified in the systematic review.
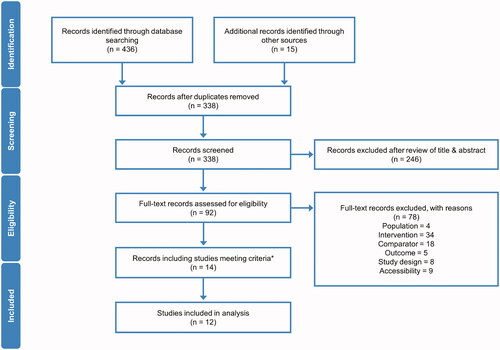
Figure 2. Pentasa versus placebo for induction of remission* at 8 weeks. Forest plot shows absolute risk difference and 95% confidence interval (CI) for Pentasa 2 g/day (A); 2–4 g/day (B); and 4 g/day (C) vs placebo. Size of blue squares represents weighting/relative size of individual studies and black diamond represents overall risk difference. *Outcomes used for remission definitions: Hanauer et al. Citation29 and PEN2A-23_UC II (Ferring 1990) = composite analysis (one or more of physician global assessment, sigmoidoscopy and biopsy); Ito et al. 2010Citation30 = Ulcerative Colitis Disease Activity Index (UCDAI); Trial 000174 (Ferring 2019) = Clinical and Endoscopic Response Score (CERS).
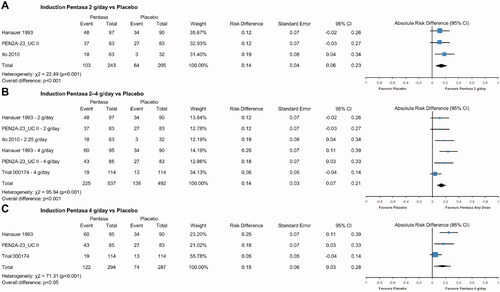
Figure 3. Pentasa versus placebo for induction of endoscopic and histologic remission* at 8 weeks. Forest plot shows absolute risk difference and 95% confidence interval (CI) for Pentasa 4 g/day vs placebo for remission assessed using Sigmoidoscopic Index (15-point scale consisting of a grade of 0–3 given for the presence of erythema, granularity/ulceration, friability, mucopus, and the appearance of the mucosal vascular pattern) (A); and biopsy score (0 = normal colonic mucosa; 1 = inactive inflammatory bowel disease [IBD]; 2 = low grade, active IBD; 3 = high grade, active IBD) (B). Size of blue squares represents weighting/relative size of individual studies and black diamond represents overall risk difference. *Outcomes used for remission definitions: (A) Hanauer et al. Citation29 and PEN2A-23_UC II (Ferring 1990) = Sigmoidoscopic Index score of 0–4 was indicative of inactive disease; (B) Hanauer et al. Citation29 and PEN2A-23_UC II (Ferring 1990) = Biopsy score of 0 or 1 with improvement of at least one category from baseline.
![Figure 3. Pentasa versus placebo for induction of endoscopic and histologic remission* at 8 weeks. Forest plot shows absolute risk difference and 95% confidence interval (CI) for Pentasa 4 g/day vs placebo for remission assessed using Sigmoidoscopic Index (15-point scale consisting of a grade of 0–3 given for the presence of erythema, granularity/ulceration, friability, mucopus, and the appearance of the mucosal vascular pattern) (A); and biopsy score (0 = normal colonic mucosa; 1 = inactive inflammatory bowel disease [IBD]; 2 = low grade, active IBD; 3 = high grade, active IBD) (B). Size of blue squares represents weighting/relative size of individual studies and black diamond represents overall risk difference. *Outcomes used for remission definitions: (A) Hanauer et al. Citation29 and PEN2A-23_UC II (Ferring 1990) = Sigmoidoscopic Index score of 0–4 was indicative of inactive disease; (B) Hanauer et al. Citation29 and PEN2A-23_UC II (Ferring 1990) = Biopsy score of 0 or 1 with improvement of at least one category from baseline.](/cms/asset/23c4ba7e-a540-4cf6-bb6e-2ffa854527ad/icmo_a_1968813_f0003_c.jpg)
Figure 4. Pentasa versus other 5-ASAs for induction of remission* at 6/8 weeks. Forest plot shows absolute risk difference and 95% confidence interval (CI) for Pentasa 2.5–3 g/day vs Eudragit-S/Eudragit-L mesalazines 2.4–3 g/day (A). Size of blue squares represents weighting/relative size of individual studies and black diamond represents overall risk difference. Bayesian meta-analysis shows Pentasa 4 g/day vs Eudragit-S/MMX mesalazine 4.8 g/day (B). †The 5% and 95% credible intervals (CrI) cross 0, indicating no significant difference at the 5% level between Pentasa 4 g/day and Eudragit-S/MMX mesalazine 4.8 g/day. MC, Monte Carlo error. *Outcomes used for remission definitions (all at 8 weeks except where noted): Gibson et al. Citation31 = Clinical Activity Index; Ito et al.Citation30, Kamm et al.Citation25 and Lichtenstein et al.Citation26 = Ulcerative Colitis Disease Activity Index (UCDAI); Hanauer et al.Citation29 and PEN2A-23_UC II (Ferring 1990) = composite analysis (one or more of Physician Global Assessment [PGA], sigmoidoscopy and biopsy); Trial 000174 (Ferring 2019) and Feagan et al.Citation27 = clinical remission (score of 0 for stool frequency and rectal bleeding, and absence of faecal urgency) at week 6.
![Figure 4. Pentasa versus other 5-ASAs for induction of remission* at 6/8 weeks. Forest plot shows absolute risk difference and 95% confidence interval (CI) for Pentasa 2.5–3 g/day vs Eudragit-S/Eudragit-L mesalazines 2.4–3 g/day (A). Size of blue squares represents weighting/relative size of individual studies and black diamond represents overall risk difference. Bayesian meta-analysis shows Pentasa 4 g/day vs Eudragit-S/MMX mesalazine 4.8 g/day (B). †The 5% and 95% credible intervals (CrI) cross 0, indicating no significant difference at the 5% level between Pentasa 4 g/day and Eudragit-S/MMX mesalazine 4.8 g/day. MC, Monte Carlo error. *Outcomes used for remission definitions (all at 8 weeks except where noted): Gibson et al. Citation31 = Clinical Activity Index; Ito et al.Citation30, Kamm et al.Citation25 and Lichtenstein et al.Citation26 = Ulcerative Colitis Disease Activity Index (UCDAI); Hanauer et al.Citation29 and PEN2A-23_UC II (Ferring 1990) = composite analysis (one or more of Physician Global Assessment [PGA], sigmoidoscopy and biopsy); Trial 000174 (Ferring 2019) and Feagan et al.Citation27 = clinical remission (score of 0 for stool frequency and rectal bleeding, and absence of faecal urgency) at week 6.](/cms/asset/dd7adb4d-b20f-43d7-b288-ee3e3becf0e7/icmo_a_1968813_f0004_c.jpg)
Figure 5. Pentasa 1.5–4 g/day† versus placebo and other 5-ASAs for maintenance of remission* at up to 12 months. Forest plot shows absolute risk difference and 95% confidence interval (CI) for Pentasa 2–4 g/day vs placebo (A); Pentasa 1.5–2.25 g/day vs Eudragit-S mesalazine 1.2–2.4 g/day and sulfasalazine 3 g/day (B); and Pentasa 1.5–4 g/day† g/day vs Eudragit-S mesalazine 1.2–3.6 g/day† and sulfasalazine 3 g/day† (C). Size of blue squares represents weighting/relative size of individual studies and black diamond represents overall risk difference. *Outcomes used for remission definitions: Trial 000175 (Ferring 2019) = Clinical and Endoscopic Response Score (CERS); Miner et al.Citation11 and Desideri et al.Citation34 = clinical and endoscopic measures; Mulder et al.Citation32 and Campieri et al.Citation33 = clinical, endoscopic and histological measures; Ito et al.Citation35 = Ulcerative Colitis Disease Activity Index (UCDAI); OPTIMUMCitation36 = partial UCDAI (stool frequency, bloody stool, and Physician Global Assessment). †OPTIMUMCitation36 was a real-life study where the most common doses reported for maintenance treatment were Pentasa 4 g/day (received by 20% of patients on Pentasa), Eudragit-S mesalazine 3.6 g/day (43%), and sulfasalazine 3 g/day (90%).
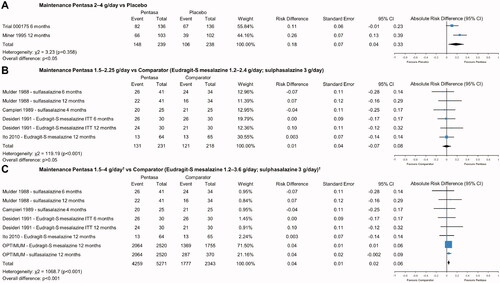
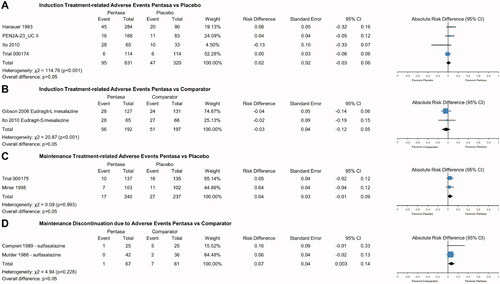
Figure 6. Safety of Pentasa vs placebo and other 5-ASAs. Forest plot shows absolute risk difference and 95% confidence interval (CI) for number of patients that experienced treatment-related adverse events (AEs) for Pentasa (1–4 g/day) vs placebo for induction treatment (A); number of patients that experienced treatment-related AEs for Pentasa (2.25–3 g/day) vs Eudragit-L mesalazine (3 g/day) and Eudragit-S mesalazine (2.4 g/day) for induction treatment; number of patients that experienced treatment-related AEs for Pentasa (2–4 g/day) vs placebo for maintenance treatment (C); and discontinuations due to AEs for Pentasa (1.5 g/day) vs sulfasalazine (3 g/day) for maintenance treatment (D). Size of blue squares represents weighting/relative size of individual studies and black diamond represents overall risk difference. Hanauer et al.Citation29 = Pentasa 1 g/day, 2 g/day or 4 g/day; PEN2A-23_UC II (Ferring 1990) = Pentasa 2 g/day or 4 g/day; Ito et al.Citation30 = Pentasa 2.25 g/day and Eudragit-S mesalazine 2.4 g/day; Trial 000174 (Ferring 2019) = Pentasa 4 g/day; Gibson et al.Citation31 = Pentasa 3 g/day and Eudragit-L mesalazine 3 g/day; Trial 000175 (Ferring 2019) = Pentasa 2 g/day; Miner et al.Citation11 Pentasa 4 g/day; Mulder et al.Citation32 and Campieri et al.Citation33 = Pentasa 1.5 g/day and sulfasalazine 3 g/day.
Supplemental Material
Download PDF (1 MB)Supplemental Material Table 4
Download MS Word (43 KB)Supplemental Material Table 3
Download MS Word (43.5 KB)Supplemental Material Table 2
Download MS Word (50.5 KB)Supplemental Material Table 1
Download MS Word (45.4 KB)Supplementary_Document_2_Search_Strings_1.0_210809.docx
Download MS Word (32.7 KB)Supplemental Material Document 1 SLR Protocol 2.0 200810
Download MS Word (51.7 KB)Data availability statement
All data relevant to the study are included in the article or uploaded as online supplemental information.