Figures & data
Table 1. Differentiation protocol to generate ICC from human pluripotent stem cells (hPSCs).
Figure 1. Characterization of human stem cell-derived ICC. Representative images of a sectioned islet-like cell cluster (stage 7) stained for insulin (A, green), glucagon (B, red), and somatostatin (C, yellow). Hoechst-staining is shown in blue (D). Overlay image of images A–D is shown in E. Scale bar, 50 µm.
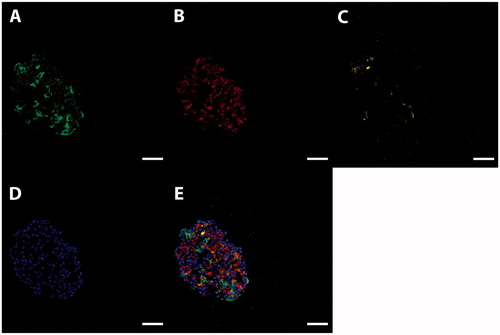
Figure 2. P75-staining of the bone marrow stromal cell culture before (A, green) and after (B, green) CD271 magnetic cell separation. Nuclei were counterstained with Hoechst (blue). The fraction of cells staining positive for P75 after CD271 magnetic cell separation was substantially increased. Scale bar, 50 µm.
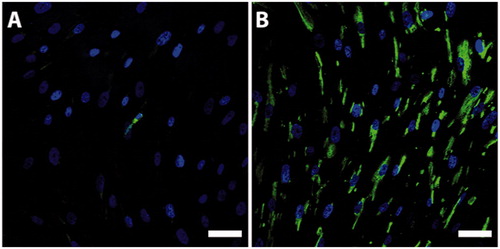
Figure 3. Immunocytochemical characterization of CD271+ (A, C, E) and CD271- (B, D, F) bone marrow stromal cells. CD271- cells were able to differentiate into smooth muscle cells, showing positive expression of SMA (B, red), but showed little or no expression of beta-3 tubulin and GFAP, and were thus unable to differentiate into neurons and glia cells, respectively. The CD271+ cells expressed SMA (A, red), beta-3 tubulin (C, green), and GFAP (E, green). Nuclei were counterstained with Hoechst (blue). Scale bar in A, B, D, E, and F, 50 µm. Scale bar in C, 20 µm.
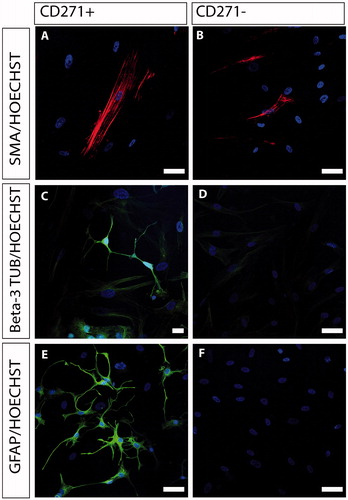
Figure 4. Nestin is a marker of immature and undifferentiated neuroepithelial cells. It has been suggested that nestin expression is a necessity for differentiation into neurons and glia cells. This picture demonstrates different levels of nestin expression in CD271+ (A, green) and CD271- (B, green) populations. Nuclei were counterstained with Hoechst (blue). Scale bar, 100 µm.
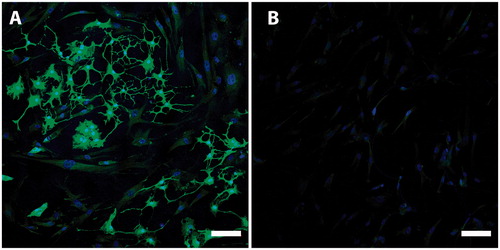
Figure 5. A single cell showing co-expression of nestin (A, green) and GFAP (B, red), demonstrating glial differentiation of a nestin-positive cell. C: Merged picture. Nuclei were counterstained with Hoechst (blue). Scale bar, 50 µm.
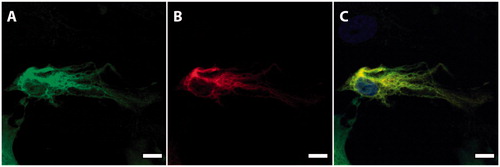
Figure 6. Co-culture of CD271+ cells and islets (A, B, C) or ICC (D, E, F) showed directed migration toward islets as well as ICC. Images were taken at day 1 (A, D), day 3 (B, E), and day 7 (C, F) of co-culture. CD271+ cells in green; islets and ICC encircled in yellow. Scale bar, 500 µm.
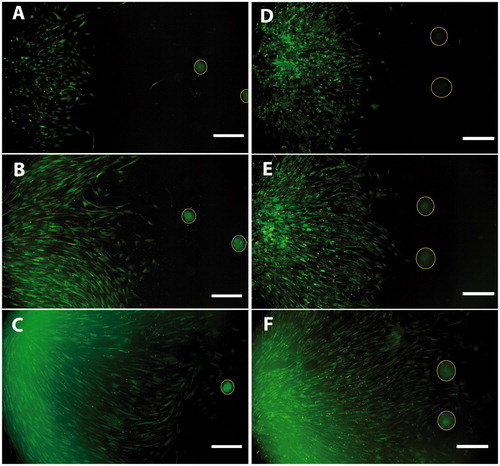
Figure 7. Overview of distance measured between migrating cells and islets (red) or ICC (green) in co-cultures. The CD271+ cells showed directed migration toward both islets and ICC, which is essential for stimulation of beta cell proliferation. The distance between the cells was measured at days 1, 3, and 7. The CD271+ cells were able to reach and enfold both the islets and ICC within 7 days of co-culture. Results are given as means ± SEM (n = 3).
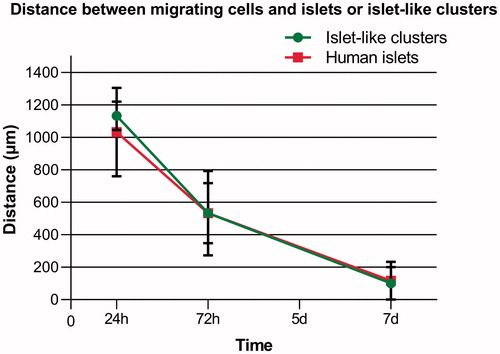
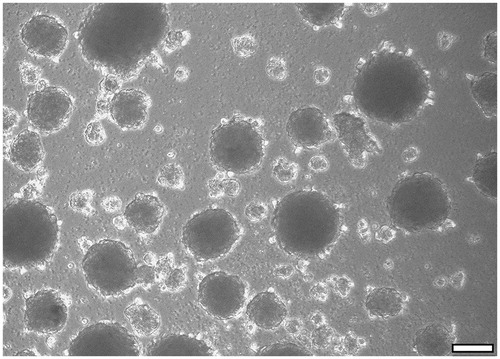
Figure 8. Sphere-forming capacity is seen as a classical characteristic of NCSC-like cells. CD271+ cells were able to form spheres when cultured under non-adherent conditions. After 14 days in culture, the majority of cells started to form spheres. Scale bar, 100 µm.