
Figures & data
Figure 1. The Recova® scoring system for systemized clinical assessment of fluid status (from Reference [Citation18]). The symptom score can total 0–16 points: 0–8 fluid overload points and 0–8 fluid depletion points.
![Figure 1. The Recova® scoring system for systemized clinical assessment of fluid status (from Reference [Citation18]). The symptom score can total 0–16 points: 0–8 fluid overload points and 0–8 fluid depletion points.](/cms/asset/a1f02366-dca1-4c13-9aa4-0659a4c62fa1/iups_a_1804495_f0001_c.jpg)
Table 1. Fluid status groups, the suggested clinical response and the plausible post-dialysis target weight to aim for in each group – as defined by recova.
Table 2. Differences in baseline characteristics between groups of different types of fluid status, based on recova definitions.
Table 3. Baseline characteristics of all enrolled patients.
Table 4. Measure of process.
Table 5. Correlations in entire sample.
Figure 2. Bioimpedance-measured median overhydration (OH) post in the four groups at baseline and at end-of-study.
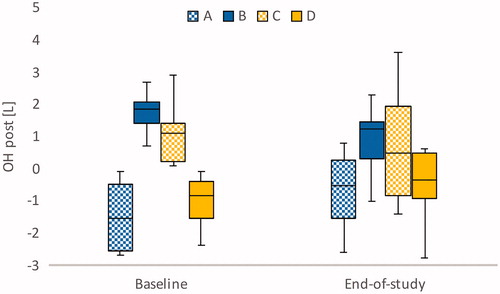
Figure 3. Comparison of distribution of pre-dialysis fluid symptom status in each group (frequencies), at baseline (BL) and at end-of-study (End).
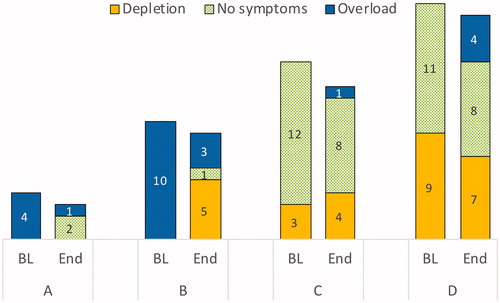
Table 6. Differences between baseline and follow-up observations in subgroups, significance tested with Wilcoxon’s non-parametric test between dependent groups.