Figures & data
Table 1. Mean fitness test scores for each nutritional status group adjusted for age and gender. Values are expressed as mean ± standard deviation and sample size (n).
Figure 1. The differences between the physical fitness test scores of children (6–13 years) classified as normal weight compared to those classified as overweight or obese (≥ IOTF cut-off for overweight) (IOTF definitions of over-nutrition (Cole et al., Citation2000)). SaR, sit-and-reach; SJ, standing long jump; SU, sit-up; SR, shuttle run; BT, cricket ball throw, significant differences indicated with *.
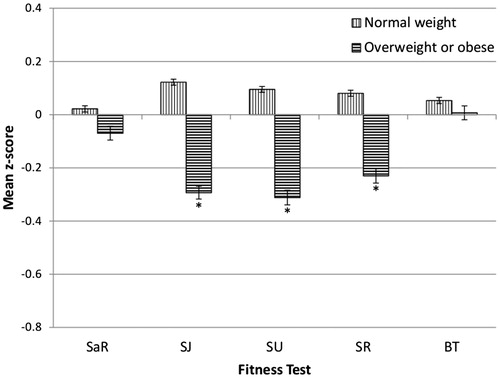
Figure 2. The differences between the physical fitness test scores of children (6–13 years) classified as normal weight compared to those classified as stunted (≤ −2 SD of height-for-age) (WHO, 2007 definitions (World Health Organisation (WHO), Citation2008)). SaR: sit-and-reach; SJ: standing long jump; SU: sit-up; SR: shuttle run; BT: cricket ball throw, significant differences indicated with *.
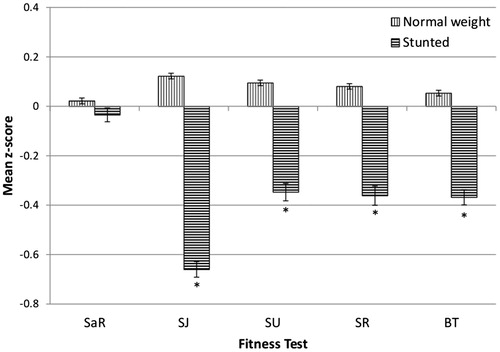
Figure 3. The differences between the physical fitness test scores of children (6–13 years) classified as normal weight compared to those classified as wasted (≤ −2 SD of BMI-for-age) (WHO, 2007 definitions (World Health Organisation (WHO), Citation2008)). SaR: sit-and-reach; SJ: standing long jump; SU: sit-up; SR: shuttle run; BT: cricket ball throw, significant differences indicated with *.
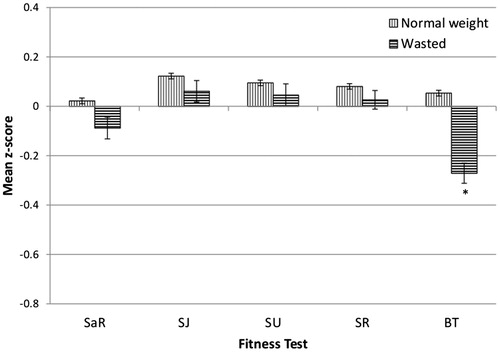
Figure 4. The differences between the physical fitness test scores of children (6–13 years) classified as normal weight compared to those classified as both stunted and wasted (≤ −2 SD of height-for-age and ≤ −2 SD of BMI-for-age) (WHO, 2007 definitions (World Health Organisation (WHO), Citation2008)). SaR: sit-and-reach; SJ: standing long jump; SU: sit-up; SR: shuttle run; BT: cricket ball throw, significant differences indicated with *.
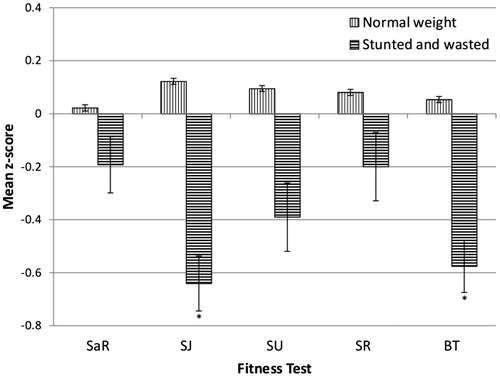
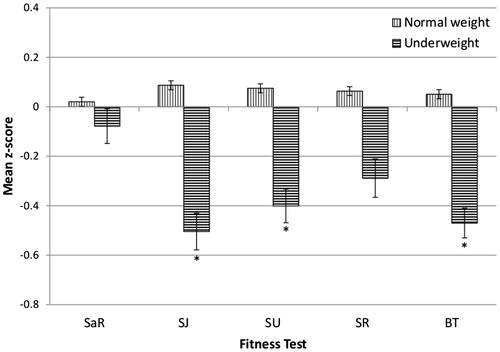
Figure 5. The differences between the physical fitness test scores of children (6–9 years) classified as normal weight compared to those classified as underweight (≤ −2 SD of weight-for-age) (WHO, 2007 definitions (World Health Organisation (WHO), Citation2008)). SaR, sit-and-reach; SJ: standing long jump; SU: sit-up; SR: shuttle run; BT: cricket ball throw, significant differences indicated with *.