
Figures & data
Figure 1. TIMER2.0 allows visualising the expression of CYP3A4 (A) and CYP3A5 (B) with different TCGA cancer data (tumour and adjacent normal tissues). The Gene_DE module in TIMER2.0 allows studying the differential expression between tumour and adjacent normal tissues for any gene of interest across all TCGA tumours. Distributions of gene expression levels are displayed using box plots. The statistical significance computed by the Wilcoxon test is annotated by the number of stars (p-value < 0.05; p-value < 0.01; p-value < 0.001). It can identify genes that are up-regulated or down-regulated in the tumours compared to normal tissues for each cancer type, as displayed in grey columns when normal data are available.
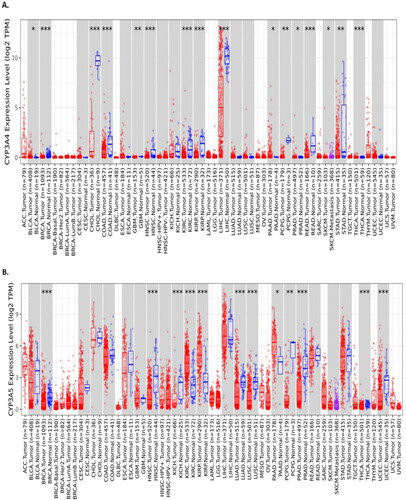
Figure 2. CYP3A4 and CYP3A5 expression with TCGA prostate cancer cases and controls was analysed using the GEPIA2 online tool. (A) CYP3A4 expression was not significantly expressed in prostate cancer risks with the total number of Prostate Adeno Carcinoma (PRAD) cases (n = 492) and control sample (n = 152) in TCGA datasets. (B) CYP3A5 expression was significantly expressed in prostate cancer risks with the total number of Prostate Adeno Carcinoma (PRAD) cases (n = 492) and control sample (n = 152) in TCGA datasets. (C) CYP3A4 and CYP3A5 expression were also positively correlated using Spearman correlation by plotting the Log2 of CYP3A4 transcript per million (TPN) versus Log2 of CYP3A5 transcript per million of TCGA prostate cancer datasets. The significance denoted by ns: not significant; * p-value < 0.05; ** p-value < 0.01; *** p-value < 0.001.
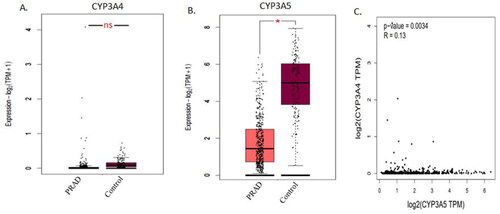
Table 1. Name of the restriction enzyme with its sites of digestion in the case of CYP3A4*1B and CYP3A5*3 alleles.
Table 2. Primers, PCR conditions, restriction enzymes (RE), and expected DNA fragments on digestion in the case of CYP3A4 and CYP3A5 genes.
Figure 3. Survival analysis of prostate cancer patient’s datasets with CYP3A4 and CYP3A5 genes. Effects of CYP3A4 and CYP3A5 expression with Gleason score on Prostate Adenocarcinoma (PRAD) patient survival (A and B). Data were analysed using the UALCAN (http://ualcan.path.uab.edu/) tool on TCGA cancer datasets. The significance was denoted by ns: not significant; * p-value < 0.05; ** p-value < 0.01; *** p-value < 0.001.
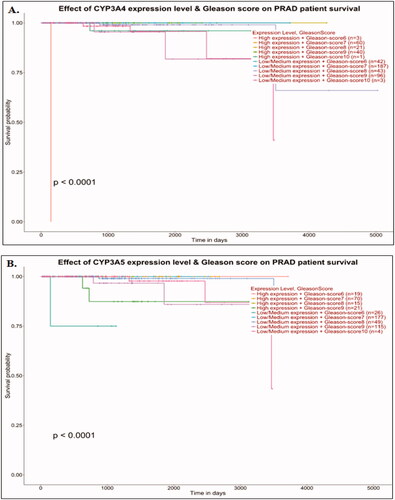
Figure 4. TIMER2.0 allows visualizing the expression with immune infiltration profile in prostate cancer. Scatter plot showed the spearman correlation in different immune cells. CYP3A4 (A, B, C and D) expression. CD8+ T cell (A) and regulatory T cell (B) showed a negative correlation whereas, M1 (C) and M2 (D) macrophages showed positive correlation with CYP3A4 expression in prostate cancer patient’s sequencing data. CYP3A5 (E, F, G and H) expression. CD8+ T cell (E) showed a positive correlation whereas regulatory T cell (F), M1 (G) and M2 (H) macrophages showed negative correlation with CYP3A5 expression in prostate cancer patient's sequencing data.
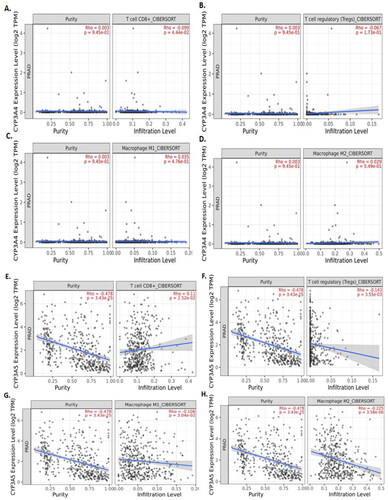
Figure 5. Schematic depiction of CYP3A4*1B and CYP3A5*3 genotypes with restriction sites of each enzyme and the resulting fragments. (A) Summary of different genotypes of CYP3A4*1B (rs2740574) and CYP3A5*3 (rs776746) with prostate cancer cases and control. (B) PCR products of CYP3A4*1B (rs2740574) with restriction site recognised by MboII restriction enzyme (RE) and the subsequent restriction fragment of CYP3A4 gene. (C) PCR product of CYP3A5*3 (rs776746) with restriction site recognised by RsaI restriction enzyme and subsequent restriction fragment of CYP3A5 gene. bp, Base pair; NH, normal homozygote; HE, heterozygote; MH, mutant homozygote.
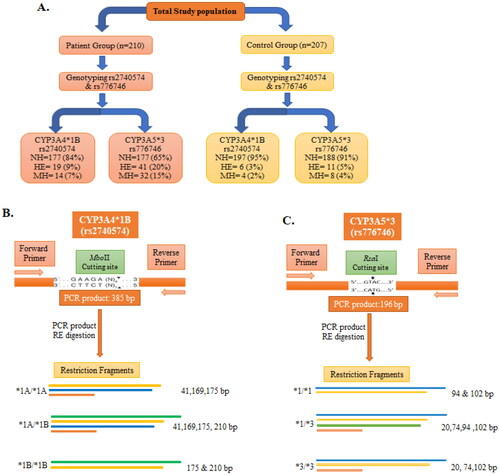
Figure 6. Obtained and observed PCR product of both CYP3A4*1B and CYP3A5*3. (A) PCR product of CYP3A4*1B: Representative images of all sample (385 bp) (Lane 3 to 10), Lane-1 contains Molecular ruler; Lane-2 contains blank. (B) PCR product of CYP3A5*3, Representative images of all sample (196 bp) (Lane 2 to 10), Lane-1 contains Molecular ruler.
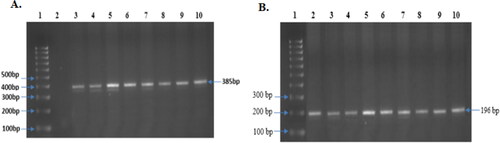
Table 3. Distribution of demographic variables of the prostate cancer cases and controls.
Figure 7. Observed Restriction Enzyme digested fragment of both CYP3A41B and CYP3A53. (A) Restriction Enzyme (MboII) digestion fragment of CYP3A41B. Representative images of all sample (Lanes 3–10) (10% Polyacrylamide gel). Lane 1, Molecular ruler; Lane 2, uncut PCR product (385 bp); Lane 3, 1B heterozygote (210, 175, 169, 41bp); Lanes 4–9, 1B Variant homozygote (175, 169, 41 bp) and Lane 10: H2O sample control. (B) Restriction Enzyme (RsaI) digestion fragment of CYP3A53. Representative images of all sample (Lanes 3–9) (10% Polyacrylamide gel). Lane 1, Molecular ruler; Lane 2, uncut PCR product (196 bp); Lanes 6 and 9, normal homozygote (94, 102 bp); Lanes 3 and 4, mutant homozygote (20, 74, 102); Lanes 5, 7, and 8, heterozygote (20, 74, 94, 102 bp) and Lane 10: H2O sample control.
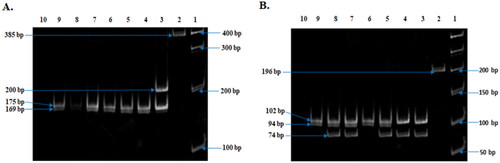
Table 4. Genotype frequencies of CYP3A4 and CYP3A5 gene polymorphisms in relation to prostate cancer cases and controls.
Table 5. Allele frequencies of CYP3A4 and CYP3A5 gene polymorphism in relation to prostate cancer cases and controls.
Supplemental Material
Download PDF (203.7 KB)Data availability statement
The data that support the findings of this study are available on request from the corresponding author.