
Figures & data
Figure 1. Classification of the subjects.
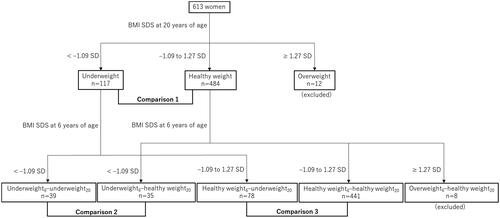
Table 1. Medians and ranges of BMI, height, and weight of the subjects.
Figure 2. Tracking BMI, height, and weight SDS. Open circles and dashed lines represent the healthy weight group. The solid circles and solid lines indicate the underweight group. The error bars represent 95% confidential intervals. (A) BMI SDS, (B) Height SDS, and (C) Weight SDS. BMI: body mass index; SDS: standard deviation score.
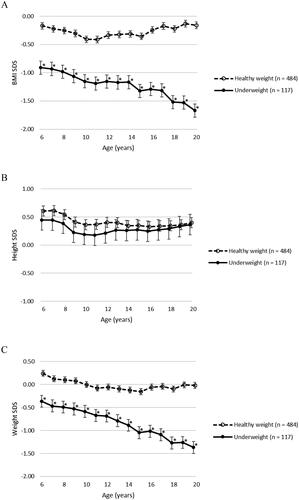
Figure 3. Tracking differences in BMI SDS (ΔBMI SDS) from 6 years of age. Open circles and dashed lines represent the healthy weight group. The solid circles and solid lines indicate the underweight group. The error bars represent 95% confidential intervals. BMI: body mass index; SDS: standard deviation score; ΔBMI SDS6–N: differences in body mass index standard deviation score from the age of 6 years to “N” years.
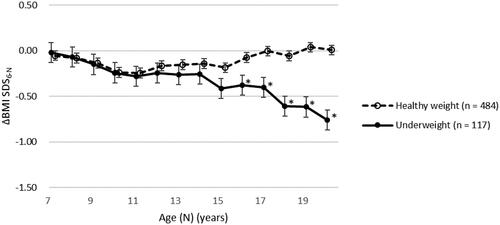
Figure 4. Tracking BMI SDS in subgroups. (A) Comparison between the underweight6–underweight20 and underweight6–healthy weight20 groups. Solid squares and solid lines indicate the underweight6–underweight20 group. Solid squares and dashed lines indicate the underweight6–healthy weight20 group. The error bars represent 95% confidential intervals. (B) Comparison between the healthy weight6–underweight20 and healthy weight6–healthy weight20 groups. Open squares and solid lines show the healthy weight6–underweight20 group. Open squares and dashed lines show the healthy weight6–healthy weight20 group. The error bars represent 95% confidential intervals. BMI: body mass index; SDS: standard deviation score.
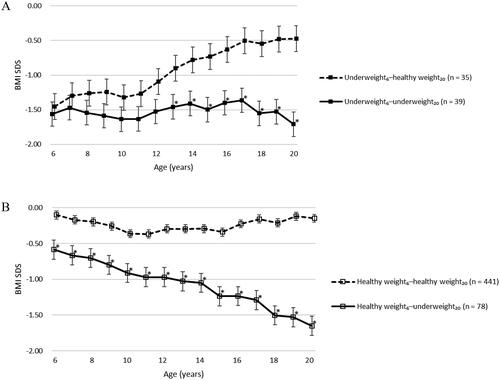
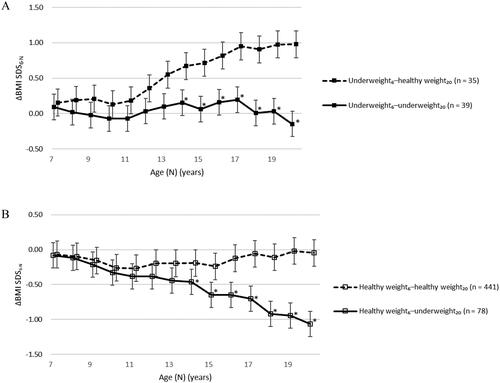
Figure 5. Tracking differences in BMI SDS (ΔBMI SDS) from 6 years of age in subgroups. (A) Comparison between the underweight6–underweight20 and underweight6–healthy weight20 groups. Solid squares and solid lines indicate the underweight6–underweight20 group. Solid squares and dashed lines indicate the underweight6–healthy weight20 group. The error bars represent 95% confidential intervals. (B) Comparison between the healthy weight6–underweight20 and healthy weight6–healthy weight20 groups. Open squares and solid lines show the healthy weight6–underweight20 group. Open squares and dashed lines show the healthy weight6–healthy weight20 group. The error bars represent 95% confidential intervals. BMI: body mass index; SDS: standard deviation score; ΔBMI SDS6–N: differences in body mass index standard deviation score from the age of 6 years to “N” years.
Data availability statement
The participants of this study did not provide written consent for their data to be shared publicly; therefore, due to the sensitive nature of the research, supporting data is not available.