Figures & data
Figure 1. This visualisation depicts a mussel farm cultivation platform. The green lines symbolise the ropes where the mussels are cultivated. Suspended beneath the ropes are yellow cylinders representing buoys, which float on the water's surface, supporting the ropes. Two perspectives are visualised: the first provides an aerial view from above the water, while the second offers an underwater perspective.
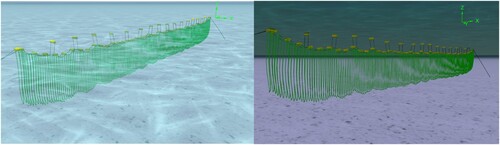
Figure 2. The proposed hierarchical coarse-to-refined reconstruction method for comprehensive mussel farm 3D reconstruction. After adaptive frame sampling, the scenes are divided into the background environment and granular key instances to reconstruct individually. These reconstructed components are then merged seamlessly to produce the final reconstructions.
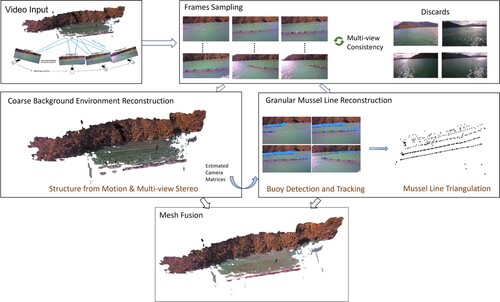
Figure 3. The data capturing device utilised is specifically designed for marine environments. Mounted on a vessel, the camera records video frames and GPS positions simultaneously during the vessel navigation, as illustrated by the red line in the map on the right-hand side.
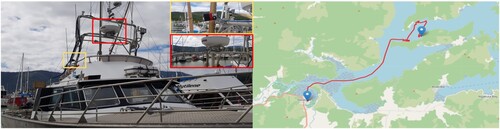
Figure 4. Coarse background environment 3D reconstruction pipeline. The SfM method is initially applied to estimate a sparse representation of the overall mussel farm environment, including camera poses for each input image. Subsequently, the MVS method is employed for dense reconstruction, and the Poisson surface reconstruction method is utilised to generate the final reconstruction.
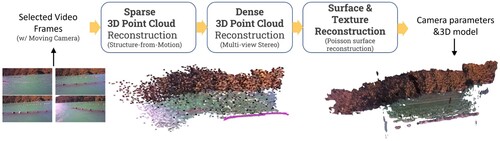
Figure 5. Granular Instance-Level Reconstruction pipeline involves object detection as the initial step, followed by trajectory filtering, triangulation, and culminating in mesh fusion.
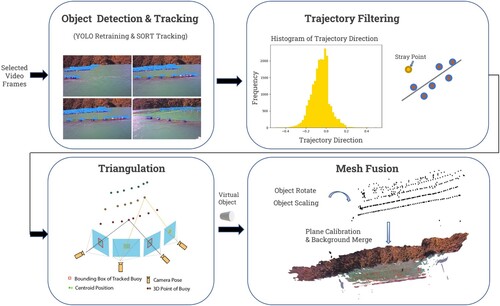
Table 1. A summary of the videos for performance evaluations.
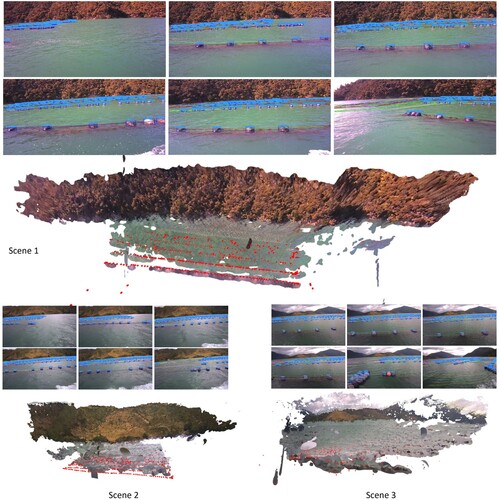
Figure 6. Results of background environment reconstruction. The top row visualises a cluster of frame images from each video.
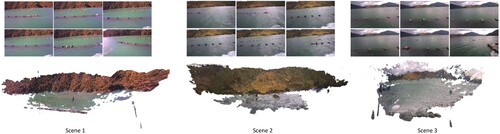
Figure 7. The detection results for buoys in various mussel farm environments are illustrated, with the bounding boxes highlighted in yellow.
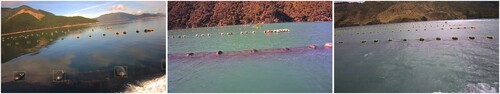
Table 2. Buoy detection results on our video data with re-trained YOLO-v7 model.
Figure 8. Matching results for buoys in two samples from distinct mussel farm environments using the SORT, OC-SORT, and DeepSORT tracking algorithms. The images presented above and below are two consecutive frames, forming a matching pair. The SORT algorithm frequently exhibits an overly dense matching line, attributed to distracting water reflections (e.g. the delineated area within the red box in the first illustration on the top row.). In contrast, OC-SORT and DeepSORT address this issue by incorporating more reliable appearance feature extraction.
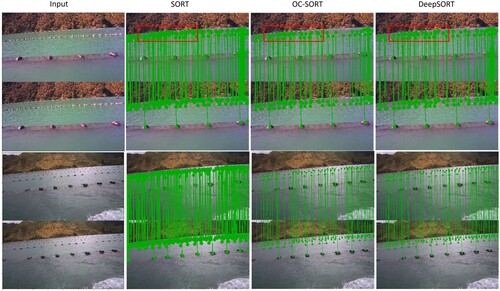
Table 3. Comparision of different buoy trackers on our video data.
Figure 9. Visualization of triangulation results with filtering at frame and identity level, and denoising for triangulated points.
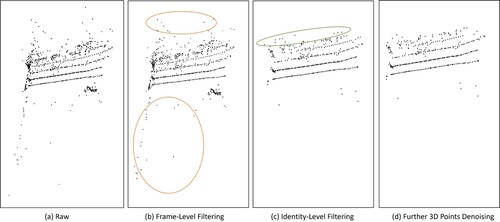
Figure 10. The conceptual illustration depicts the triangulation accuracy metrics. The calculation involves assessing the occurrence of switches in the neighbours of each buoy (red dot), considering the left (orange dot), right (purple dot), up (front) (green dot), and down (behind) (blue dot) directions as four main misplacements.
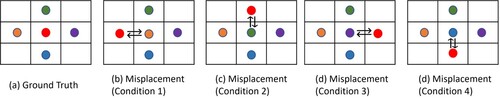
Table 4. Results of triangulation accuracy on our video data.
Figure 11. Final reconstruction results display both the background environment and instance-level mussel lines, with each reconstructed buoy highlighted in red for enhanced visibility.