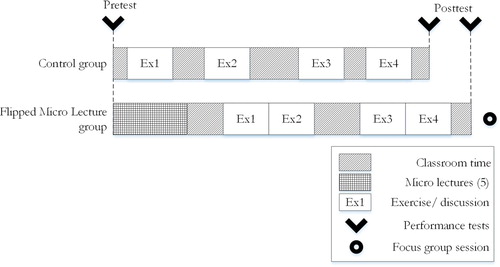
Figures & dataFigure 1. Schematic illustration of the experimental setup and data collection moments.Display full sizeTable 1. Shapiro-Wilk normality test.Download CSVDisplay TableTable 2. Descriptive statistics of the pre-post test scores.Download CSVDisplay TableTableDownload CSVDisplay Table