1,867
Views
15
CrossRef citations to date
0
Altmetric
ORIGINAL ARTICLES

Pathogenesis of highly pathogenic avian influenza A virus (H7N1) infection in chickens inoculated with three different doses

, , , , , , , , & show all
Pages 163-172 | Received 14 Sep 2010, Published online: 15 Apr 2011

Figures & data

Table 1.  Distribution of AIV nucleoprotein antigen determined by immunohistochemistry in tissue samples from G1 chickens inoculated with H7N1 HPAIV.

Figure 1. Immunohistochemical detection of influenza A viral nucleoprotein in the nasal cavity of SPF chickens inoculated intranasally with 105.5 ELD50 of H7N1 A/Chicken/Italy/5093/99 at 7 d.p.i. Epithelial necrosis in the transition between respiratory and olfactory epithelium of the nasal cavity, associated with the presence of viral antigen (brown staining) in the olfactory (arrow), and respiratory epithelial cells, Bowman glands (a), mucous glands (b) and inflammatory cells in lamina propria from a G1 chicken at 7 d.p.i.
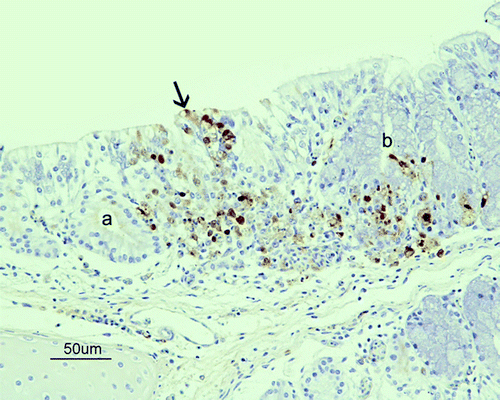
Figure 1.  Immunohistochemical detection of influenza A viral nucleoprotein in the nasal cavity of SPF chickens inoculated intranasally with 105.5 ELD50 of H7N1 A/Chicken/Italy/5093/99 at 7 d.p.i. Epithelial necrosis in the transition between respiratory and olfactory epithelium of the nasal cavity, associated with the presence of viral antigen (brown staining) in the olfactory (arrow), and respiratory epithelial cells, Bowman glands (a), mucous glands (b) and inflammatory cells in lamina propria from a G1 chicken at 7 d.p.i.

Figure 2. Immunohistochemical detection of influenza A viral nucleoprotein in the liver of SPF chickens inoculated intranasally with 105.5 ELD50 (G1) of H7N1 A/Chicken/Italy/5093/99 at 5 d.p.i. Influenza A viral antigen detected in Kupffer cells, endothelial cells and mononuclear intravascular cells in the liver.
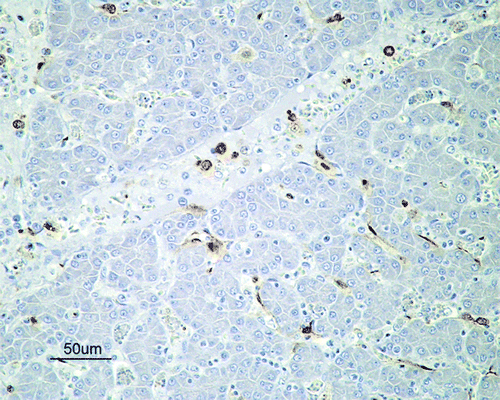
Figure 2.  Immunohistochemical detection of influenza A viral nucleoprotein in the liver of SPF chickens inoculated intranasally with 105.5 ELD50 (G1) of H7N1 A/Chicken/Italy/5093/99 at 5 d.p.i. Influenza A viral antigen detected in Kupffer cells, endothelial cells and mononuclear intravascular cells in the liver.

Figure 3. Immunohistochemical detection of influenza A viral nucleoprotein in the spinal cord of SPF chickens inoculated intranasally with 105.5 ELD50 (G1) of H7N1 A/Chicken/Italy/5093/99 at 3 d.p.i. Viral antigen was detected on ependymal cells surrounding the central canal and in the nearest glial cells and neurons in the grey matter from a G1 chicken at 3 d.p.i.
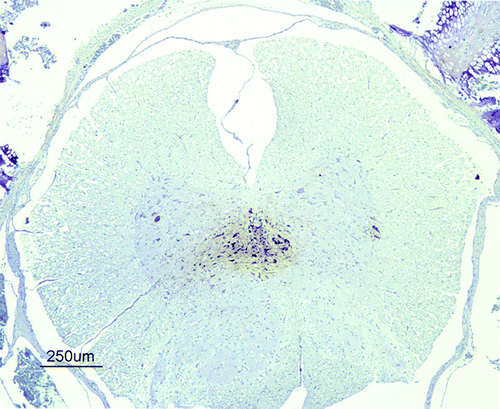
Figure 3.  Immunohistochemical detection of influenza A viral nucleoprotein in the spinal cord of SPF chickens inoculated intranasally with 105.5 ELD50 (G1) of H7N1 A/Chicken/Italy/5093/99 at 3 d.p.i. Viral antigen was detected on ependymal cells surrounding the central canal and in the nearest glial cells and neurons in the grey matter from a G1 chicken at 3 d.p.i.

Figure 4. Viral RNA detected by RT-qPCR expressed as log10 viral RNA copies per gram of tissue in samples of the brain, lung, intestine, and kidney collected from day 1 to day 10 in G1 (4a) birds and from day 1 to day 16 in group G2 (4b) and G3 (4c). Rates above the bars indicate the relation between positive birds and the total of birds examined. Limit of detection indicated by the dashed line (2.28 log10 viral RNA copies/g tissue).
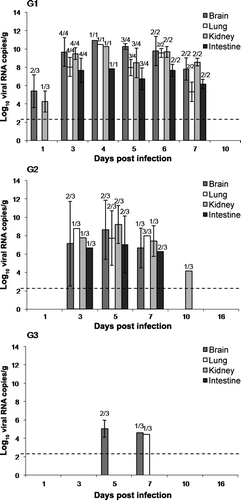
Figure 4.  Viral RNA detected by RT-qPCR expressed as log10 viral RNA copies per gram of tissue in samples of the brain, lung, intestine, and kidney collected from day 1 to day 10 in G1 (4a) birds and from day 1 to day 16 in group G2 (4b) and G3 (4c). Rates above the bars indicate the relation between positive birds and the total of birds examined. Limit of detection indicated by the dashed line (2.28 log10 viral RNA copies/g tissue).

Figure 5. Viral RNA levels detected by RT-qPCR in 1 ml oropharyngeal and cloacal swabs obtained from day 1 to day 10 in G1 (5a) birds and from day 1 to day 16 in group G2 (5b) and G3 (5c). Dotted line indicates the limit of the detection. Rates above the bars indicate the relation between positive birds and the total of birds examined. Limit of detection indicated by the dashed line (1.46 log10 viral RNA copies/ml).
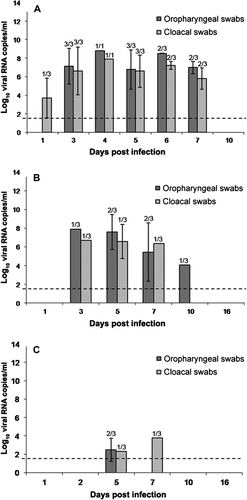
Figure 5.  Viral RNA levels detected by RT-qPCR in 1 ml oropharyngeal and cloacal swabs obtained from day 1 to day 10 in G1 (5a) birds and from day 1 to day 16 in group G2 (5b) and G3 (5c). Dotted line indicates the limit of the detection. Rates above the bars indicate the relation between positive birds and the total of birds examined. Limit of detection indicated by the dashed line (1.46 log10 viral RNA copies/ml).

Reprints and Corporate Permissions

Please note: Selecting permissions does not provide access to the full text of the article, please see our help page How do I view content?

To request a reprint or corporate permissions for this article, please click on the relevant link below:

Academic Permissions

Please note: Selecting permissions does not provide access to the full text of the article, please see our help page How do I view content?

Obtain permissions instantly via Rightslink by clicking on the button below:

If you are unable to obtain permissions via Rightslink, please complete and submit this Permissions form. For more information, please visit our Permissions help page.