Figures & data
Table 1. Vaccination schedule of the chickens before being used in the experiment presented in this studya.
Figure 1. Injection site (pectoral muscle) of a treated chicken. Note the moderate to severe swelling, the presence of granuloma-like structures and petechiae.
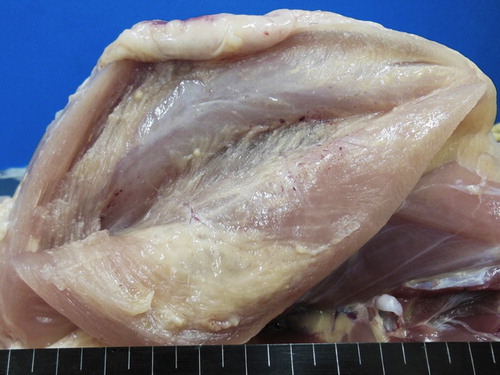
Table 2. Clinical and gross findings of experimental AA amyloidosis in chickens.
Figure 2. Livers of treated chickens. Severe hepatomegaly and haemorrhages are present and hepatic parenchyma showed inconsistent discolouration with patchy green to yellowish-brown areas, or sometimes red-brown areas; scale bar = 1 cm.
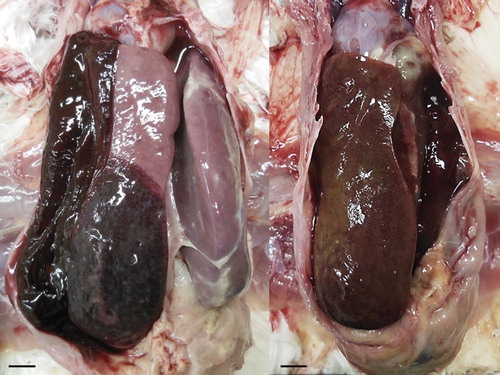
Figure 3. (a) Histopathological changes in the liver of a treated chicken showing amyloid deposition in the space of Disse and hepatic cord atrophy. HE stain. (b) Amyloid shown in the space of Disse in a liver section of a treated chicken. Immunohistochemistry with MX-AA antibodies. (c) SAA mRNA appears strongly positive in hepatocytes of a treated chicken. In situ hybridization.
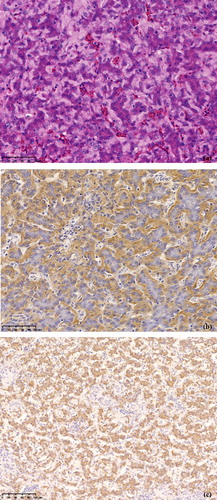
Table 3. Distribution and severity of amyloid deposition in affected chickens, vaccinated with high doses of inactivated oil-emulsion vaccines.
Figure 4. (a) Large vacuoles likely representing remnants of inactivated oil-emulsion vaccine surrounded by macrophages, multinucleated giant cells, plasma cells, lymphocytes, and heterophils with fibrosis. HE stain. (b) Amyloid shown in the surrounding of the large vacuoles likely representing remnants of inactivated oil-emulsion vaccine at the injection sites of treated chickens. Immunohistochemistry with MX-AA antibodies. (c) Amyloid appears as apple-green birefringence in a tissue sample of the injection site of a chicken when viewed with polarized light under a light microscope. Congo red stain. Scale bar = 100 μm. (d) SAA mRNA is abundantly shown in the periphery of granulomas at the injection site in treated chickens. In situ hybridization. (e) High magnification of (d) shows that the positive signals are detected in spindle-shaped cells. In situ hybridization.
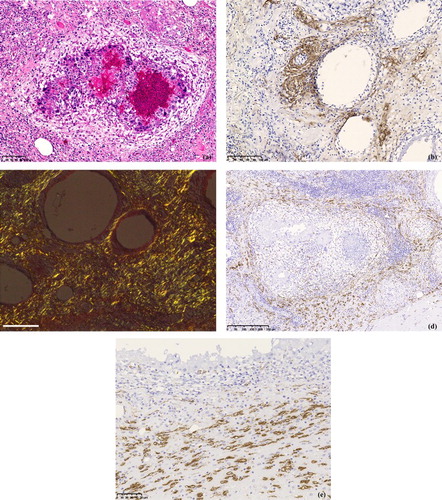
Figure 5. SAA mRNA RT-PCR results at the injection site of treated chickens shows clear bands (1: distilled water, 2: control group, 3–6: treated group).