
Figures & data
Table 1. FDA approved drugs utilizing lipid systems.
Figure 1. Multidimensional (2D) scaling of the chemical structures of the dataset reveals high structural diversity. The axes (V1 and V2) represent chemical space in two directions.
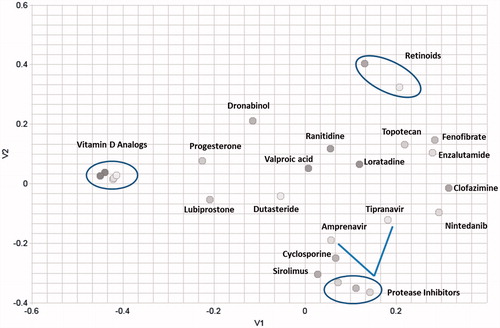
Table 2. Lipid formulation classification system.
Figure 2. Quantitative assessment of chemical properties. (A) molecular weight, (B) polar surface area, (C) LogP, (D) logarithm of octanol solubility, and (E) correlation between octanol solubility and LogP.
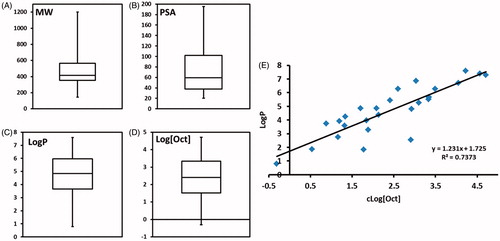
Figure 3. Integration of different classification systems. (A) applicability of lipid formulation based on compound’s LogP. Markers represent individual LogP and line represents median LogP (B) relationship between BCS and DCS.
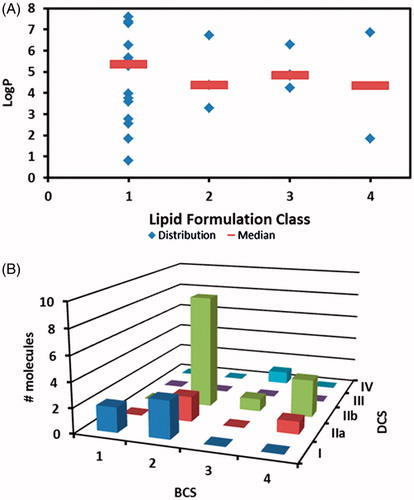
Figure 4. DCS plot of FDA approved drugs formulated using LBDDS with LFCS represented by different markers.
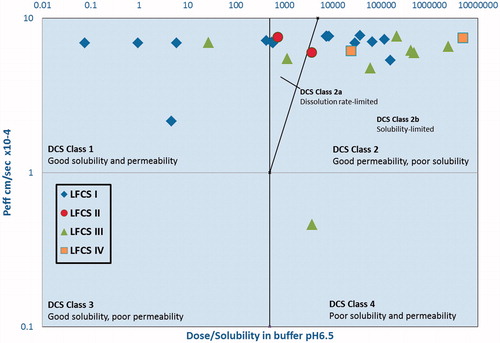
Table 3. Food effects and pharmacokinetics of approve drugs.
Table 4. Oral amphotericin formulations in development.