
Figures & data
Figure 1. % Sand (a), % silt (b), % clay (c) and bulk density (d) after LUC in soil profile (1 m). Horizontal bars represent standard error of the mean (SEM), and different lowercase letters indicate statistically significant differences between the land-use types for the specific depth; capital letters indicate statistically significant differences between the soil layers for the same land-use types (p < 0.05). PRC: monocrop paddy rice, SC6: it was converted from paddy rice to sugarcane for 6 years, SC13: it was converted from paddy rice to sugarcane for 13 years, and SC17: it was converted from paddy rice to sugarcane for 17 years.
Figure 2. Cation exchange capacity (CECpH7) (a), soil pH (pH1:1H2O) (b), organic matter (SOM) (c) and available phosphorus (pav) (d) after LUC in soil profile (1 m). horizontal bars represent standard error of the mean (SEM), and different lowercase letters indicate statistically significant differences between the land-use types for the specific depth; capital letters indicate statistically significant differences between the soil layers for the same land-use types (p < 0.05). LUC: land use change, PRC: monocrop paddy rice, SC6: it was converted from paddy rice to sugarcane for 6 years, SC13: it was converted from paddy rice to sugarcane for 13 years, and SC17: it was converted from paddy rice to sugarcane for 17 years.
Table 1. Significance of single and interacted factors influencing the soil physicochemical properties.
Figure 3. Exchangeable K (Kex) (a), exchangeable Ca (Caex) (b), total N (Total N) (c), soil NH4+-N (NH4+-N) (d), soil NO3−N (NO3− -N) (e) and total mineral nitrogen (Total mineral N) (f) after LUC in soil profile (1 m). Horizontal bars represent Standard Error of the Mean (SEM), and different lowercase letters indicate statistically significant differences between the land-use types for the specific depth; capital letters indicate statistically significant differences between the soil layers for the same land-use types (p < 0.05). LUC: land use change, PRC: monocrop paddy rice, SC6: it was converted from paddy rice to sugarcane for 6 years, SC13: it was converted from paddy rice to sugarcane for 13 years, and SC17: it was converted from paddy rice to sugarcane for 17 years.
Figure 4. Annual apparent nitrogen (a), phosphorus (b) and potassium (c) balances in different land use (kg ha−1) and N, P, K uptakes (d) of crop at final harvest. Vertical bars represent Standard Error of the Mean (SEM), and different lower-case letters indicate statistically significant differences (p < 0.05). LUC: land use change, PRC: monocrop paddy rice, SC6: it was converted from paddy rice to sugarcane for 6 years, SC13: it was converted from paddy rice to sugarcane for 13 years, and SC17: it was converted from paddy rice to sugarcane for 17 years.
Figure 5. Internal Nutrient use efficiency (IEN,P,K):[yield/total N, P, K uptake] (a), and Partial factor productivity of applied Nutrient (PFPN,P,K): [yield/Nutrient applied] (b) of crop at final harvest. Vertical bars represent standard error of the mean (SEM), and different lower-case letters indicate statistically significant differences (p < 0.05). LUC: land use change, PRC: monocrop paddy rice, SC6: it was converted from paddy rice to sugarcane for 6 years, SC13: it was converted from paddy rice to sugarcane for 13 years, and SC17: it was converted from paddy rice to sugarcane for 17 years.
![Figure 5. Internal Nutrient use efficiency (IEN,P,K):[yield/total N, P, K uptake] (a), and Partial factor productivity of applied Nutrient (PFPN,P,K): [yield/Nutrient applied] (b) of crop at final harvest. Vertical bars represent standard error of the mean (SEM), and different lower-case letters indicate statistically significant differences (p < 0.05). LUC: land use change, PRC: monocrop paddy rice, SC6: it was converted from paddy rice to sugarcane for 6 years, SC13: it was converted from paddy rice to sugarcane for 13 years, and SC17: it was converted from paddy rice to sugarcane for 17 years.](/cms/asset/80392fb9-2f80-4921-b3ca-f056114cd460/gags_a_2330496_f0005_b.gif)
Table 2. Cane populations and plant height of sugarcane at 4, 6, 8, 10 and 12 months after harvesting (MAH).
Table 3. Single stalk weight, millable cane, leaf weight, °Brix, commercial cane sugar (CCS), and dry weight of sugarcane at final harvest.
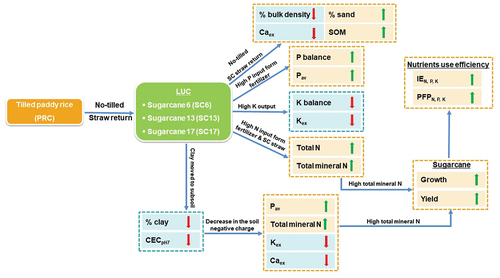
Figure 6. A conceptual diagram illustrating the impact of land use change from tilled paddy rice to long-term no-till sugarcane cropping, with consecutive returns of sugarcane straw, on various soil physicochemical properties, nutrient balance, yield and nutrient use efficiency of sugarcane.
Supplemental Material
Download MS Word (1.7 MB)Data availability statement
The data are available upon request from the authors.