
Figures & data
Figure 1. Fractional polynomial regression (prediction line) of micronutrient biomarker concentration on day of cycle when measurement occurred; adjusted zinc (A), copper (B), magnesium (C), manganese (D), the log of iron (E), the log of adjusted ferritin (F), adjusted retinol (G), and hemoglobin (H). Solid black lines represent the prediction line. Short-dash gray lines represent the 95% prediction interval for the prediction line. (119 data points, n = 45).
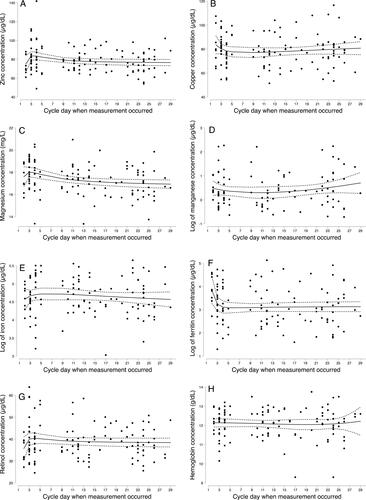
Table 1. Means and within-person differences in micronutrient biomarker concentrations across a single menstrual cycle in women of reproductive age (n = 45) †.
Figure 2. Prevalence of micronutrient deficiencies across the menstrual cycle (n = 45). EFP, early follicular phase; IDA, iron deficiency anemia (hemoglobin <12 g/dL and ferritin <15µg/L); LFP, late follicular phase prospective; MLP, Midluteal phase. Zinc and ferritin were adjusted for inflammation before cut points were applied. Adjusted for inflammation using the following correction factors: no inflammation (CRP ≤5 mg/L and AGP ≤1 g/L); incubation (CRP >5 mg/L and AGP ≤1 g/L); early convalescence (CRP >5 mg/L and AGP >1 g/L); late convalescence (CRP ≤5 mg/L and AGP >1 g/L) (Citation40). The correction factors with reference to no inflammation were; 0.92,1.05, and 1.09 for zinc (Citation41); 0.83,0.48, and 0.65 for ferritin (Citation41); and 1.14,1.31, and 1.12 for retinol (Citation40).
*Bars with an different superscripts k are statistically significantly different from each other as tested by mixed-effects logistic regression (p < 0.05).
There was no vitamin A deficiency (i.e., retinol (< 20µg/dL)) at any visit.
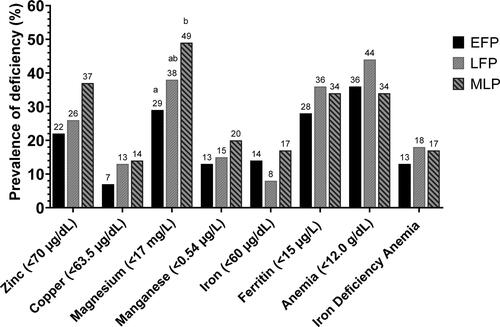
Table 2. Mean serum circulating mass of micronutrient biomarkers and inflammatory marker at the early follicular phase, late follicular phase, and midluteal phase in the menstrual cycle of reproductive age women (n = 45) †.