
Figures & data
Figure 1. Flow chart of the study. Abbreviations: PDAC = pancreatic ductal adenocarcinoma, DEGs = differentially expressed genes.
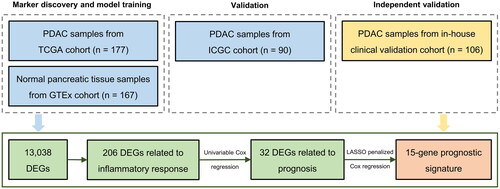
Table 1. Clinicopathologic characteristics of the patients with PDAC in TCGA cohort, ICGC cohort, and our clinical validation cohort.
Figure 2. DEGs associated with inflammatory response in PDAC patients. (A) Volcano map shows 13,038 DEGs between normal pancreatic tissue samples in GTEx cohort (n = 167) and PDAC samples in TCGA cohort (n = 177). (B) Heat map shows the top 25 upregulated genes and the top 25 downregulated genes. (C) Chromosomal distribution of up- and down-regulated inflammation-related DEGs in PDAC patients. The blue lines represent down-regulated DEGs; the red lines represent up-regulated DEGs; the blue squares represent down-regulated inflammation-related DEGs; the red circles represent up-regulated inflammation-related DEGs. (D) Oncoprint shows the inflammation-related DEGs with the top 20 somatic mutation frequencies. (E) Gene functional enrichment of 206 inflammation-related DEGs by Gene ontology (GO) analysis and Kyoto Encyclopedia of Genes and Genomes (KEGG) analysis. BP, CC, and MF represent biological processes, cellular components, and molecular functions, respectively.
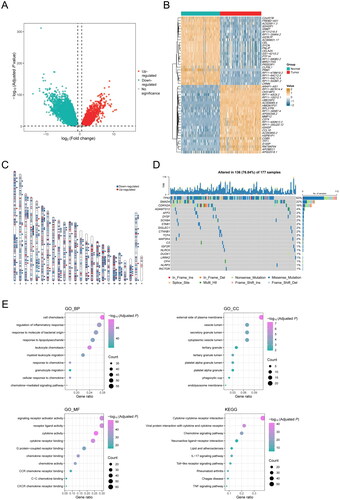
Figure 3. Construction of a 15-gene inflammation signature with prognostic value in PDAC patients. (A) Univariable Cox analysis displayed the hazard ratio (HR) value and 95% confidence interval (CI) of 32 inflammation-related DEGs for overall survival (OS). (B) Kaplan-Meier (KM) curve shows the OS of PDAC patients stratified based on the median expression level of RIPK2. (C) KM curve shows the OS of PDAC patients stratified based on the median expression level of IL17D. (D) KM curve shows the OS of PDAC patients stratified into the low- and high-risk groups based on the median risk score in the TCGA cohort. (E) Validation of the prognostic value of the gene signature by time-dependent receiver operating characteristic (ROC) curve in the TCGA cohort. (F) Heat map of expression level of each characteristic gene in the high- and low-risk groups.
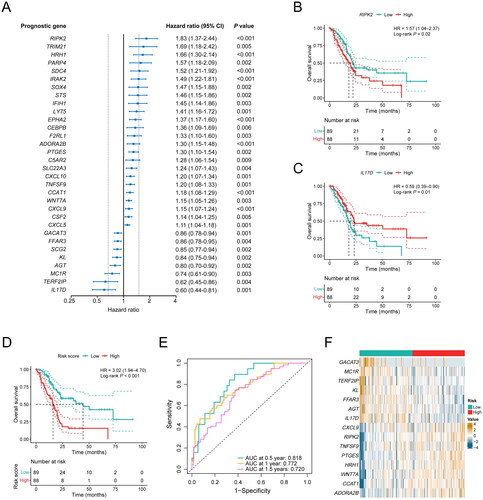
Figure 4. Performance validation of the inflammation-related gene signature. (A) KM curve shows the OS of PDAC patients stratified into the low- and high-risk groups based on the median risk score in the ICGC cohort. (B) Validation of the prognostic value of the gene signature by time-dependent ROC curve in the ICGC cohort. (C) Heat map of expression level of each characteristic gene in the high- and low-risk groups in the ICGC cohort. (D) KM curve shows the OS of PDAC patients stratified into the low- and high-risk groups based on the median risk score in our clinical validation cohort. (E) Validation of the prognostic value of the gene signature by time-dependent ROC curve in our clinical validation cohort. (F) Heat map of expression level of each characteristic gene in the high- and low-risk groups in our clinical validation cohort.
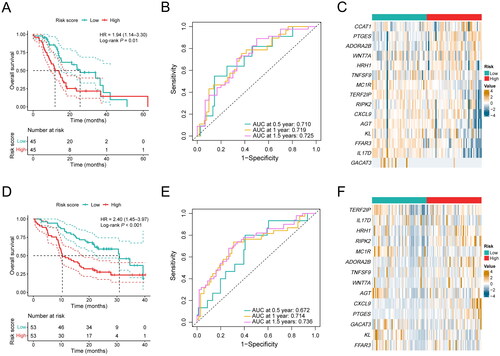
Table 2. Univariable and multivariable Cox regression analysis of clinicopathologic factors and inflammation-related gene signature for OS in the TCGA cohort.
Table 3. Univariable and multivariable Cox regression analysis of clinicopathologic factors and inflammation-related gene signature for OS in the ICGC cohort.
Table 4. Univariable and multivariable Cox regression analysis of clinicopathologic factors and inflammation-related gene signature for OS in our clinical validation cohort.
Figure 5. Association between the inflammation-related gene signature and immune characteristics. (A) Composition of C1–C6 immune subtypes in the low-risk (n = 67) and high-risk (n = 83) groups in the TCGA cohort. (B) Comparison of leukocyte fraction and stromal fraction between the low-risk (n = 89) and high-risk (n = 87) groups in the TCGA cohort. (C) Comparison of immune subtype-related signatures between the low-risk (n = 67) and high-risk (n = 83) groups in the TCGA cohort. (D) Correlation analysis between the 15 characteristic genes, risk score and the 22 immune cell subpopulations estimated by CIBERSORT. (E) The relative proportions of 22 immune cell subpopulations estimated by CIBERSORT were compared between the low-risk (n = 89) and high-risk (n = 88) groups in the TCGA cohort. *P < 0.05; **P < 0.01; ***P < 0.001; ****P < 0.0001.
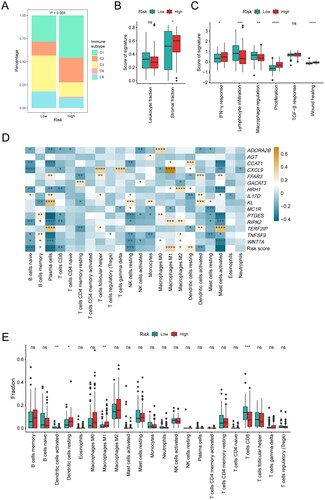
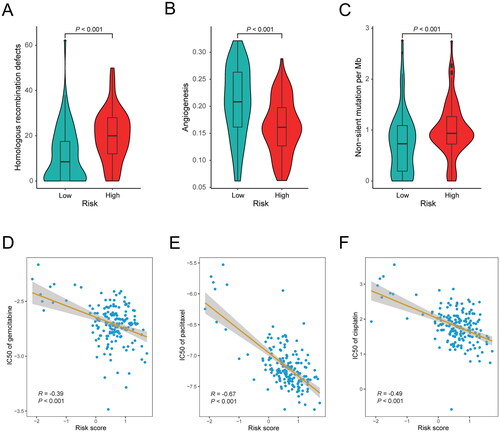
Figure 6. Association between the inflammation-related gene signature and drug sensitivity. (A) Comparison of homologous recombination deficiency (HRD) score between the low-risk (n = 76) and high-risk (n = 80) groups in the TCGA cohort. (B) Comparison of angiogenesis score between the low-risk (n = 67) and high-risk (n = 83) groups in the TCGA cohort. (C) Comparison of tumor mutational burden (TMB) between the low-risk (n = 89) and high-risk (n = 86) groups in the TCGA cohort. (D–F) Correlation analysis between the gene signature and the log value of IC50 of three chemotherapeutic drugs: gemcitabine (D), paclitaxel (E) and cisplatin (F).
Supplemental Material
Download PDF (154.6 KB)Data availability
The relevant data supporting the findings of this study are available within the paper. Due to ethical and privacy concerns, we are unable to publish the patient-level data in our study, of which readers may contact the corresponding authors for the access for non-commercial purposes.