Publication Cover
Chronobiology International
The Journal of Biological and Medical Rhythm Research
Volume 35, 2018 - Issue 7
1,320
Views
3
CrossRef citations to date
0
Altmetric
Original Articles

The role of the daily feeding rhythm in the regulation of the day/night rhythm in triglyceride secretion in rats

, , , &
Pages 885-895 | Received 12 Dec 2017, Accepted 05 Feb 2018, Published online: 15 Feb 2018

Figures & data

Table 1. Information on gene primers.

Figure 1. The daily rhythm of plasma TG (a) and TG secretion (b). Data are presented as mean±SEM. Gray area represents the dark period.

Figure 1. The daily rhythm of plasma TG (a) and TG secretion (b). Data are presented as mean±SEM. Gray area represents the dark period.

Figure 2. Effects of a 6-meals-a-day feeding (6M) schedule on basal plasma TG levels (a) and the daily TG secretion rhythm (b). Data are presented as mean±SEM. White bars – Ad libitum (AL) animals, Black bars – 6M animals. * indicates a significant difference between ZT11 and ZT23 for the AL animals, p ≤ 0.05.
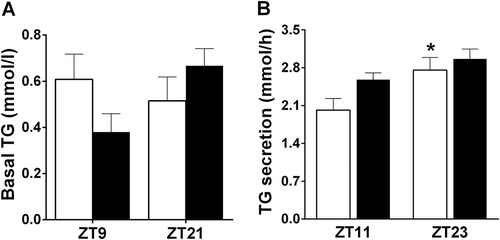
Figure 2. Effects of a 6-meals-a-day feeding (6M) schedule on basal plasma TG levels (a) and the daily TG secretion rhythm (b). Data are presented as mean±SEM. White bars – Ad libitum (AL) animals, Black bars – 6M animals. * indicates a significant difference between ZT11 and ZT23 for the AL animals, p ≤ 0.05.

Figure 3. Effects of a 6-meals-a-day feeding schedule (6M) on the 24 h profile of body temperature and locomotor activity. (a) The 24 h profile of body temperature; (b) the day/night rhythm of body temperature; (c) the 24 h profile of locomotor activity (values are percentages of 24 h-mean); (d) the day/night rhythm of locomotor activity (values are percentages of 24h-mean) and (e) the day/night rhythm of food intake. Data are presented as mean±SEM. White bars and Grey line – AL animals, Black bars and Black line – 6M animals. * indicates a significant difference between night and day, p < 0.05. # indicates a significant difference between 6M and AL animals, p < 0.05.
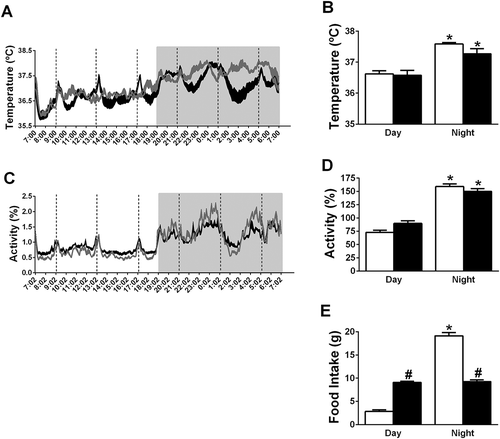
Figure 3. Effects of a 6-meals-a-day feeding schedule (6M) on the 24 h profile of body temperature and locomotor activity. (a) The 24 h profile of body temperature; (b) the day/night rhythm of body temperature; (c) the 24 h profile of locomotor activity (values are percentages of 24 h-mean); (d) the day/night rhythm of locomotor activity (values are percentages of 24h-mean) and (e) the day/night rhythm of food intake. Data are presented as mean±SEM. White bars and Grey line – AL animals, Black bars and Black line – 6M animals. * indicates a significant difference between night and day, p < 0.05. # indicates a significant difference between 6M and AL animals, p < 0.05.

Table 2. Effects of the 6-meals-a-day feeding schedule on daily gene expression rhythms in liver.

Figure 4. Effects of a 6-meals-a-day (6M) feeding schedule on daily gene expression rhythms in liver. *p < 0.05. Open circles – data points of AL group. Solid line – Circwave calculated curve for AL group. Solid circles – data points of 6M group. Dashed line – circwave calculated curve for experimental 6M group.
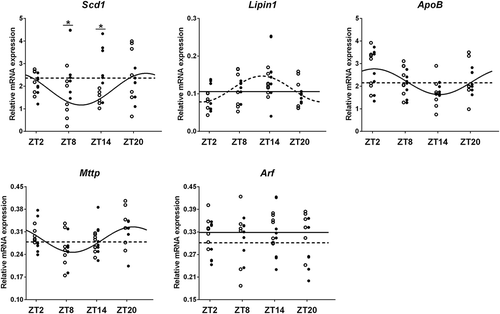
Figure 4. Effects of a 6-meals-a-day (6M) feeding schedule on daily gene expression rhythms in liver. *p < 0.05. Open circles – data points of AL group. Solid line – Circwave calculated curve for AL group. Solid circles – data points of 6M group. Dashed line – circwave calculated curve for experimental 6M group.

Table 3. Circwave V1.4 analysis of effects of a 6-meals-a-day feeding schedule on daily TG secretion related gene expression rhythms in liver.