Figures & data
Table 1. Cohort characteristics. The sleep cohort was matched by length of record, age, gender and race. Numbers for gender, race, and ethnicity correspond to percentages. Numbers for age, phecodes and visits correspond to mean (SD). P values are based on a student’s t-test.
Figure 1. Distribution of self-reported bed and wake times for the sleep cohort. Bedtimes past midnight were adjusted to separate bed and wake times and ease visualization.
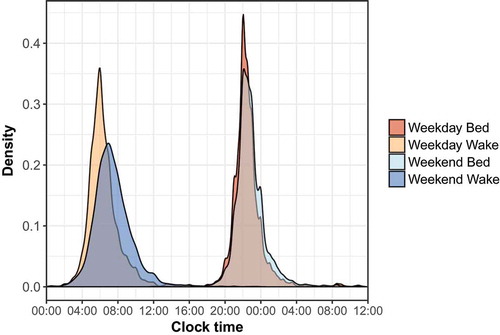
Table 2. Model statistics for final weekday sleep duration (n = 3405), weekend sleep duration (n = 3399), social sleep lag (n = 3324), and weekend sleep midpoint (n = 3391) models in an ordinal regression procedure. Numbers represent p values for each predictor variable, and asterisks indicate the model described in the main text and figures. Age is modeled as a restricted spline in both individual and interaction terms which contain age. Model building and selection is detailed in Supplementary Files 1–4.
Figure 2. Weekday and weekend sleep duration (in hours) as a function of age across gender (a, b) and race (c, d) in the sleep cohort. Gender, race, and age as a restricted spline were all significant predictor variables in both weekday and weekend models. Shaded regions represent best-fit 95% confidence intervals in an ordinal regression procedure.
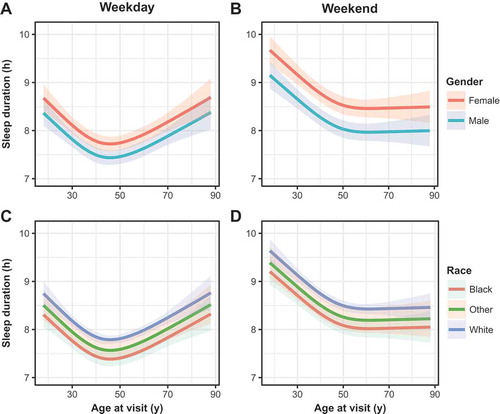
Figure 3. (a) Social sleep lag (in hours) as a function of age as a restricted spline in the sleep cohort. Niether gender nor race were significant predictors in this model, and thus the model predictions for the entire cohort is depicted here. (b) Weekend sleep midpoint, adjusted to the circular mean of midpoint for the sleep cohort, with model predictions across gender and the first quartile, mean and 3rd quartile of BMI, which were significant interaction variables with age in the chosen model. Shaded regions represent best-fit 95% confidence intervals in an ordinal regression procedure.
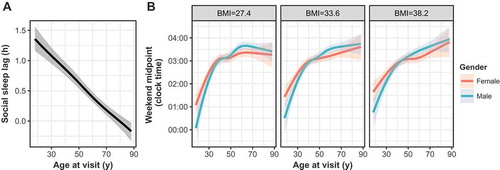
Figure 4. PheWAS for (a) weekend sleep duration and (b) weekday sleep duration. Light grey lines indicate q = 0.05, and darker grey lines q = 0.01. Phecodes with q < 0.05 are annotated, except for weekday sleep duration (for ease of visualization).
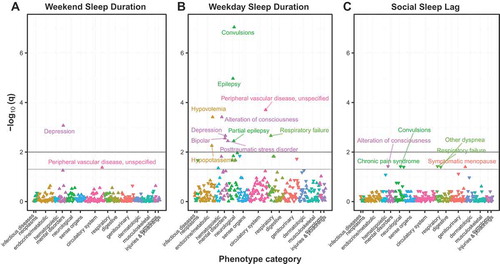
Table 3. Genetic association analysis with weekday and weekend sleep duration in an ordinal regression model (n = 555). Asterisks indicate SNPs previously associated with chronotype, while those without asterisks indicate SNPs in high LD (r2 > 0.80) with any of these published SNPs.
Figure 5. (a) Weekend sleep duration and (b) weekday sleep duration by alleles of variant rs3754214 in the sleep cohort with extant genotyping (n = 555), significant in an ordinal regression procedure.