
Figures & data
Figure 1. Effect of low and high doses (100 and 200 mg/kg, respectively). MgO-zein nanowires on serum levels of different electrolytes measured in male and female rats. Results are shown as mean ± SD (n = 5). #Significance at p ≤ .05 using One-way ANOVA succeeded by Tukey HSD test.
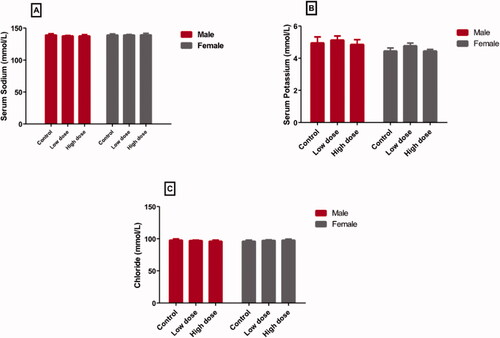
Figure 2. Effect of low and high doses (100 and 200 mg/kg, respectively). MgO-zein nanowires on serum levels of liver function markers measured in male and female rats. Results are shown as mean ± SD (n = 5). #Significance at p ≤ .05 using One-way ANOVA succeeded by Tukey HSD test.
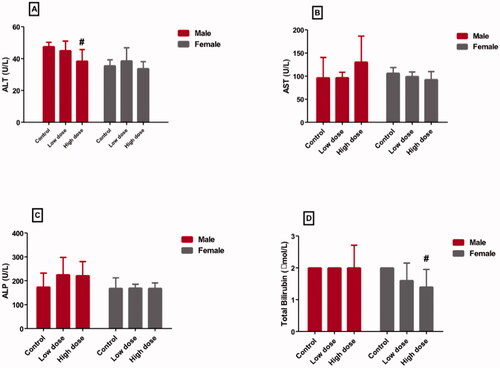
Figure 3. Effect of low and high doses (100 and 200 mg/kg, respectively). MgO-zein nanowires on serum levels of kidney function markers measured in male and female rats. Results are shown as mean ± SD (n = 5). #Significance at p ≤ .05 using One-way ANOVA succeeded by Tukey HSD test.
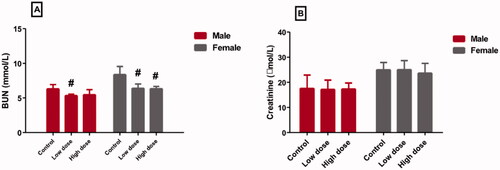
Figure 4. Illustrative photographs displaying the effect of low and high doses (100 and 200 mg/kg, respectively). MgO-zein nanowires on liver histopathology in male rats (H & E stain × 200). Control group (A,B) showed A: normal central vein (CV), hepatocyte cell cords (black arrows), separated by narrow sinusoids (white arrows), cell nuclei are rounded and vesicular; B: normal portal area contents [bile duct (BD), hepatic artery (HA), and branches of portal vein (PV)]. Low dose group (C,D) showed (C) normal hepatic architecture with the normal central vein (CV) and hepatocyte cell cords (arrows), blood sinusoids showed slight dilation (white arrows) with prominent Kupffer cells (dotted arrows); (D) Slight congestion and dilatation of portal vein (PV), the proliferation of bile ducts (BD) and slight proliferation of connective tissue were seen in the portal area (white star) while nearby hepatocytes showed active vesicular nuclei (arrows). High dose group (E,F) showed (E) no alteration of hepatic parenchyma normal slightly dilated central vein (CV), normal hepatocytes with active nuclei (black arrows), prominent Kupffer cells (dotted arrows); (F) portal area showed proliferation of bile duct (BD) and slight congestion of portal veins (PV), besides vessel congestion with an increase in periductal connective tissue (stars) while nearby hepatocytes showed active vesicular nuclei (arrows).
![Figure 4. Illustrative photographs displaying the effect of low and high doses (100 and 200 mg/kg, respectively). MgO-zein nanowires on liver histopathology in male rats (H & E stain × 200). Control group (A,B) showed A: normal central vein (CV), hepatocyte cell cords (black arrows), separated by narrow sinusoids (white arrows), cell nuclei are rounded and vesicular; B: normal portal area contents [bile duct (BD), hepatic artery (HA), and branches of portal vein (PV)]. Low dose group (C,D) showed (C) normal hepatic architecture with the normal central vein (CV) and hepatocyte cell cords (arrows), blood sinusoids showed slight dilation (white arrows) with prominent Kupffer cells (dotted arrows); (D) Slight congestion and dilatation of portal vein (PV), the proliferation of bile ducts (BD) and slight proliferation of connective tissue were seen in the portal area (white star) while nearby hepatocytes showed active vesicular nuclei (arrows). High dose group (E,F) showed (E) no alteration of hepatic parenchyma normal slightly dilated central vein (CV), normal hepatocytes with active nuclei (black arrows), prominent Kupffer cells (dotted arrows); (F) portal area showed proliferation of bile duct (BD) and slight congestion of portal veins (PV), besides vessel congestion with an increase in periductal connective tissue (stars) while nearby hepatocytes showed active vesicular nuclei (arrows).](/cms/asset/40fe9cea-21ce-4abc-a63b-2d8fb5c7436b/iann_a_1991587_f0004_c.jpg)
Figure 5. Illustrative photographs displaying the effect of low and high doses (100 and 200 mg/kg, respectively). MgO-zein nanowires on liver histopathology in female rats (H & E stain × 200). Control group (A,B) showed (A) normal central vein (CV), hepatocyte cell cords (black arrows), cell nuclei are rounded and vesicular; (B) normal portal vein (PV). Low dose group (C,D) showed (C) normal hepatocytes cell cords with their rounded active vesicular nuclei (black arrows); (D) portal regions (PV) showed slight congestion of blood portal veins, normal bile ducts, and connective tissue. High dose group (E,F) showed (E) hepatocytes with slightly small nuclei and condensed chromatin at central vein region (black arrows); (F) hepatocytes with slightly small nuclei and condensed chromatin at portal veins (PV) regions (black arrows).
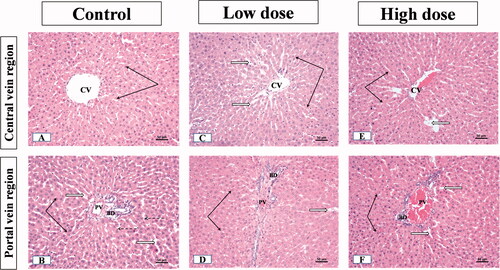
Figure 6. Illustrative photographs displaying the effect of low and high doses (100 and 200 mg/kg, respectively). MgO-zein nanowires on kidney histopathology in male rats (H & E stain × 200). Control group (A,B) showed normal renal corpuscle (white arrow), glomeruli (star), and tubules (black arrows). Low dose group (C,D) showed mild dilation of glomerular capillaries (white arrows and star) and tubules also showed mild dilation. High dose group (E,F) showed focal disorganization or atrophy of glomerular capillaries (stars), and tubules are dilated and contain scanty hyaline material (black arrows).
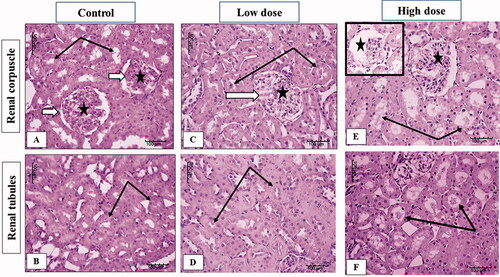
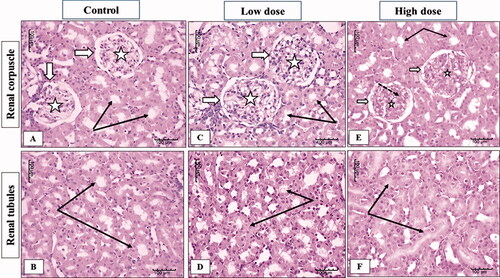
Figure 7. Illustrative photographs displaying the effect of low and high dose (100 and 200 mg/kg, respectively). MgO-zein nanowires on kidney histopathology in female rats (H & E stain × 200). Control group (A,B) showed normal renal corpuscles (white arrows) with its glomerular capillaries (stars), renal tubules showed intact normal cell lining (black arrows). Low dose group (C,D) showed an enlarged renal corpuscle with increase glomerular cellularity, no apparent change in renal tubules (black arrows). High dose group (E,F) showed normal renal corpuscle (white arrows) with a decrease in cellular density (stars) and increase mesangial substances (dotted arrows), renal tubules showed active large nuclei (black arrows).
Data availability statement
Data are available from the corresponding author upon reasonable request.