
Figures & data
Figure 1. The flowchart of the study.
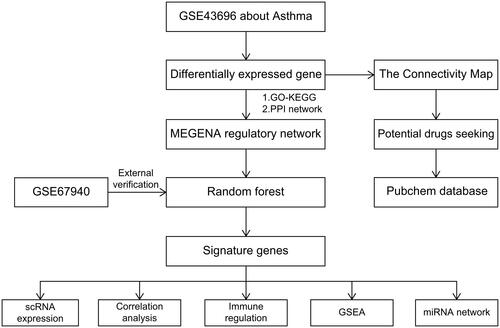
Table 1. The clinical characteristics and treatment history of the cases.
Figure 2. Identification of asthma differential genes: (A,B) Volcano plot and heat map of DEGs, with blue indicating downregulation and pink indicating upregulation. (C,D) Bar chart of enriched GO and KEGG pathways of differential genes.
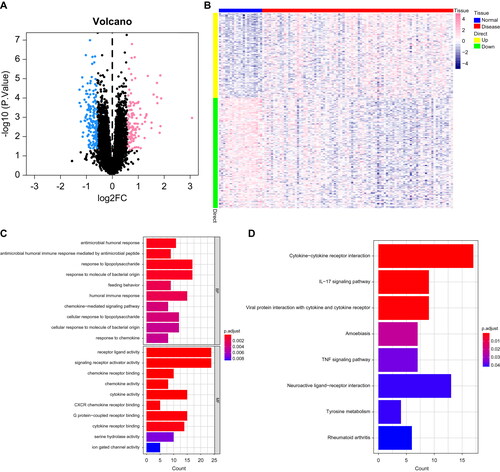
Figure 3. Machine learning methods identify key genes: (A) Co-expression network of DEGs, where each node represents a module, with larger nodes indicating more genes. (B) Display of feature genes using the Random Forest algorithm. (C) Validation of expression patterns based on the external dataset GSE67940.
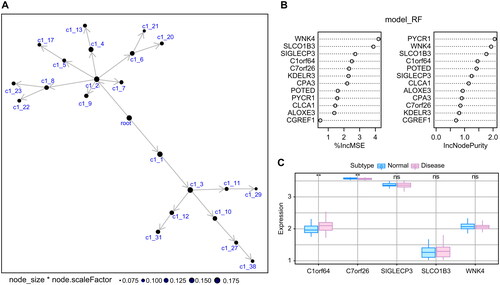
Figure 4. The relationship between key genes and immune factors: Pearson correlation heat map of key genes and immune factors, where A–E represent Immunoinhibitor, chemokine, MHC, Immunostimulator, and receptor, respectively.
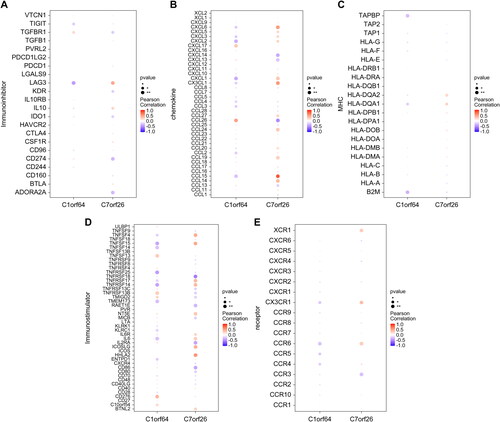
Figure 5. GSEA enrichment analysis of key genes: (A,B) The specific display of two key gene-enriched KEGG signaling pathways, where the pathways enriched in high expression are shown above the vertical axis, and those enriched in low expression are shown below the vertical axis. (C) miRNA network of key genes based on the mircode database.
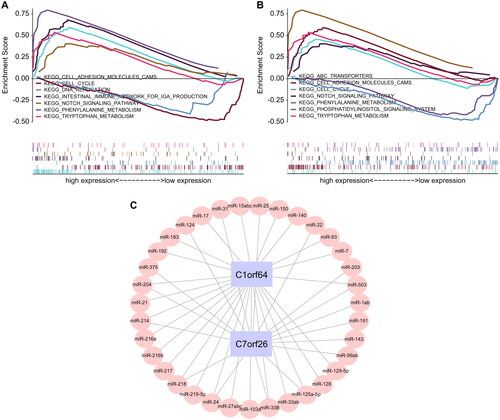
Figure 6. Correlation analysis of asthma regulatory genes: (A) Pearson correlation analysis of asthma disease regulatory genes and key genes, where blue represents negative correlation and red represents positive correlation. (B) 2D structural diagrams of four potential therapeutic drugs.
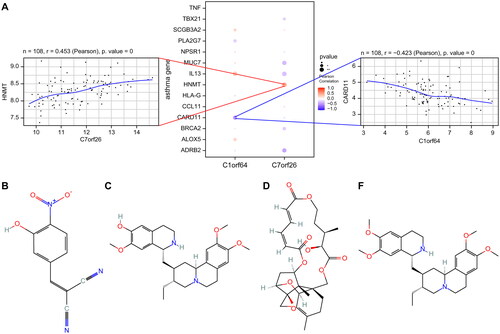
Figure 7. Single-cell atlas of asthma: (A) TSNE plot of cell clustering in asthma, with all cells identified as T cells, NK cells, and B cells. (B) Expression of key genes in single cells. (C) Bubble plot of key gene expression in cells.
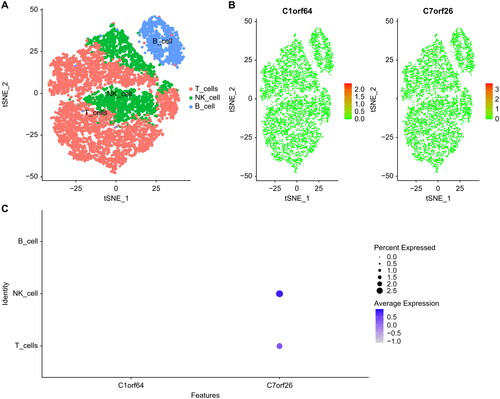
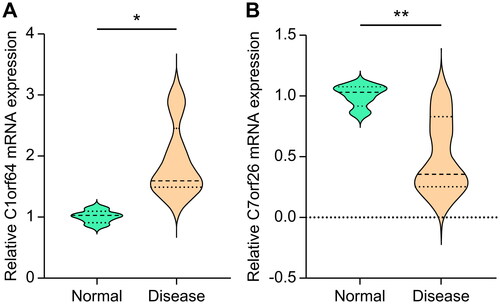
Figure 8. The mRNA expression levels of key genes: (A) C1orf64 and (B) C7orf26.
Data availability statement
The data that supports the findings of this study, including any relevant details needed to reproduce the published results, are available from the corresponding author upon reasonable request.