
Figures & data
Figure 1. Flow diagram of eligibility criteria of the present study. A total of 40 omnivores, 37 lacto-ovo-vegetarians and 38 vegans were enrolled in the study. The resulting cohort was comprised of three dietary groups with comparable age, sex, marital status, educational level, and ethnicity.
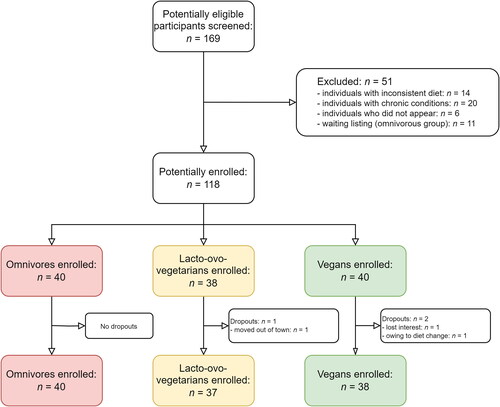
Table 1. Sociodemographic and anthropometric data of study participants by dietary group.
Table 2. Nutrient intake data of study participants by dietary group.
Table 3. Supplementation characteristics of study participants by dietary group.
Table 4. Laboratory measurements by dietary group.
Figure 2. Multivariate analysis of laboratory biomarkers of health. (A) Main contributing biomarkers to the variance of the first principal component resulting from the PPCA analysis. The analysis retrieved biomarkers of vitamin B12 status (vitamin B12, holoTC, Hcy), iron (iron, ferritin, transferrin) and lipid metabolism (vitamin A, HDL, LDL, total cholesterol, TAG) as most contributors to the separation across dietary types. (B) Nonmetric dimension scaling analysis (NMDS). each point represents the laboratory biomarker profile of each individual (dots) in 3-dimensions separated in six plots (NMDS2 versus NMDS1, NMDS3 versus NMDS1 and NMSD3 versus NMDS2). points closer to each other represent more similar biomarker profiles, and points away from each other represent more different biomarker profiles. Squares represent the centroid across individuals with the same diet (average across individuals for each dimension).
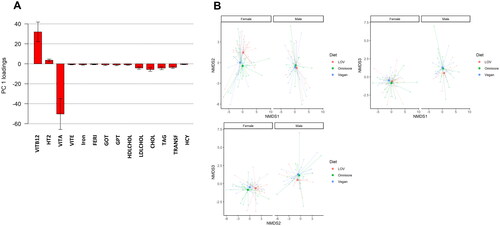
Table 5. Results of PERMANOVA analysis.
Figure 3. Biomarkers of vitamin B12 status. (A) Plasma vitamin B12. (B) Plasma holoTC. (C) Plasma MMA. (D) Plasma Hcy. Dark red shadowing denotes values below or above reference ranges indicative of vitamin B12 deficiency. Light red shadowing depicts values that classify as low vitamin B12 or subclinical vitamin B12 deficiency. p values were adjusted for multiple comparisons using the holm method. The reference ranges utilized in this study were as follows: Hcy: 5–15 µM; MMA: <0.260 µM; holoTC: <35 pM, and vitamin B12: <149 pM deficiency; 149–250 pM subclinical deficiency; and >250 pM normal.
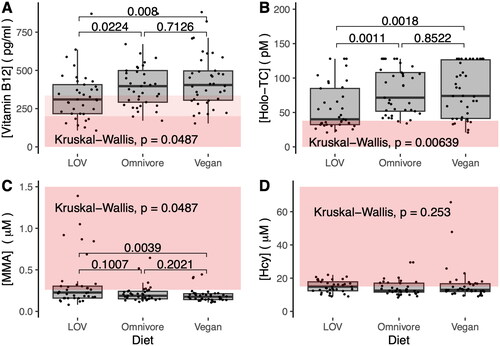
Figure 4. Combined vitamin B12 index (cB12). The status of vitamin B12 was assessed using the four-biomarker cB12 index, with adjustment for age and plasma folate concentration, as described in the studies by Fedosov et al. [Citation36]. The area shadowed with light red corresponds to a status of low vitamin B12 wherein the initiation of supplementation has been recommended [Citation36]. In this study, lacto-ovo-vegetarians followed by the vegan group possessed the greatest number of individuals with low vitamin B12.
![Figure 4. Combined vitamin B12 index (cB12). The status of vitamin B12 was assessed using the four-biomarker cB12 index, with adjustment for age and plasma folate concentration, as described in the studies by Fedosov et al. [Citation36]. The area shadowed with light red corresponds to a status of low vitamin B12 wherein the initiation of supplementation has been recommended [Citation36]. In this study, lacto-ovo-vegetarians followed by the vegan group possessed the greatest number of individuals with low vitamin B12.](/cms/asset/69d63494-3209-4ce0-be5e-12176ac94ed5/iann_a_2269969_f0004_c.jpg)
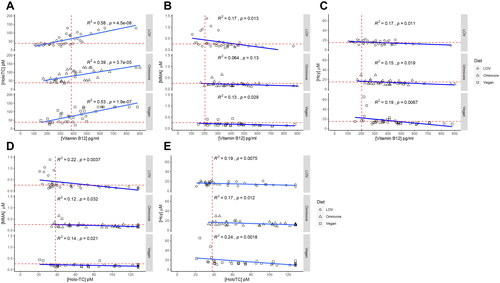
Figure 5. Correlation of biomarkers of vitamin B12 status. (A) Plasma vitamin B12 and holo-TC were positively correlated independently of dietary pattern. (B) Correlation between MMA and plasma vitamin B12. (C) Correlation between Hcy and plasma vitamin B12. (D) Correlation between MMA and plasma holoTC. (E) Correlation between Hcy and plasma holoTC. A negative correlation was identified between plasma vitamin B12 or holo-TC and the metabolites MMA and Hcy (panels B–E). MMA and vitamin B12 were negatively correlated in plant-based diets but not in omnivores. Light blue shadowing around the regression line: confidence interval. R2: coefficient of determination; p: p-value.
Supplemental Material
Download MS Word (61.5 KB)Supplemental Material
Download Zip (239.1 KB)Data availability statement
Data contained in this manuscript will be made available upon reasonable request.