
Figures & data
Figure 1. Course of the study: a schematic overview. BSFS: Bristol Stool Form Scale; GLQI: Gastrointestinal Life Quality Index; CCFIS: Cleveland Clinic Fecal Incontinence Score; IPAQ: International Physical Activity Questionnaire; MASS: MacArthur Scale of Subjective Social Status.
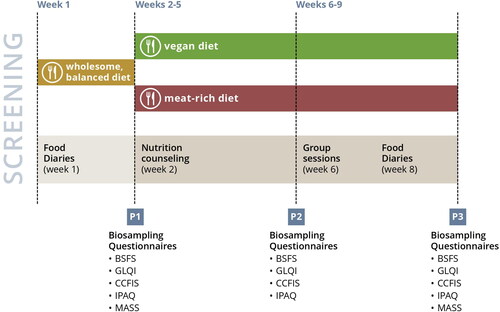
Figure 2. Participant inclusion flowchart.
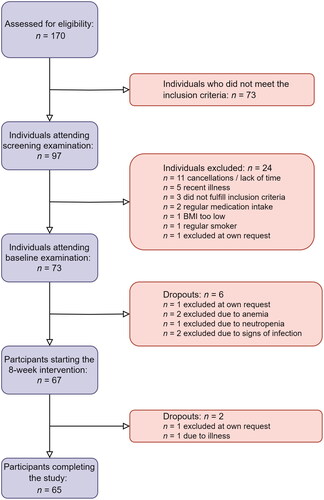
Table 1. Sample characteristics including sociodemographic, anthropometric and physical activity data at baseline, after 4 weeks and after 8 weeks of the dietary intervention.
Table 2. Bowel movement frequency, defecation patterns and gastrointestinal life quality at baseline, after 4 weeks and after 8 weeks of the dietary intervention.
Table 3. Nutrient intakes at baseline and after 8 weeks of the dietary intervention.
Figure 3. Macronutrient profile in both groups before and after the intervention. Stripplot showing macronutrient profiles for both groups at baseline (top) and after eight weeks (bottom). MD: Meat-rich diet; VD: Vegan diet.
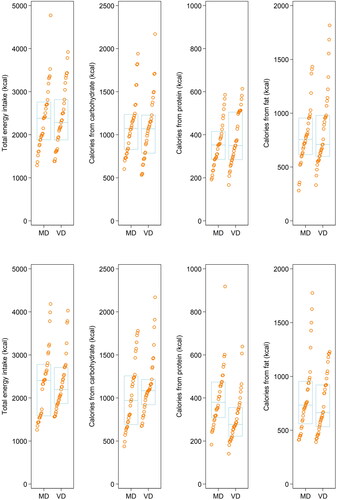
Table 4. Intakes of selected food groups related to bowel health and dietary group at baseline and after 8 weeks of the dietary intervention.
Figure 4. Scatterplots visualizing the relationship between BM frequency and fiber intake (top) and GIQLI and fiber intake (bottom). BM: Bowel Movement; GIQLI: Gastrointestinal Quality of Life Index. One outlier (fiber intake per day: 120 g) in the vegan group was removed to highlight full cohort behavior over the casuality of one outlier. Spearman’s rho for fiber intake and GIQLI was 0.27 (p = .03), whereas it was not significant for fiber and BM frequency.
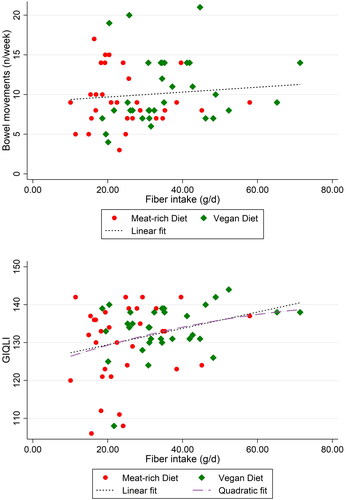
Table 5. Comparison of BM frequency, BSFS, and GIQLI across dietary groups.
Supplemental Material
Download Zip (926.9 KB)Data availability statement
The datasets used and analyzed for the current study are available from the corresponding author on reasonable request.