
Figures & data
Table 1. Clinical characteristics of SLE patients and healthy controls.
Figure 1. Purity and viability of neutrophils isolated from human peripheral whole blood. Neutrophils isolated from 4 mL of peripheral EDTA anticoagulant whole blood were treated by percoll discontinuous density gradient centrifugation. The neutrophils were detected by staining with fixable viability dye (FVD), anti-CD15 antibody and anti-CD14 antibody. FACS gating strategy for identifying the viability and purity of neutrophils were shown (A). The hyper-segmented neutrophils were mainly observed by Wright’s staining and 1000× oil microscope (B).
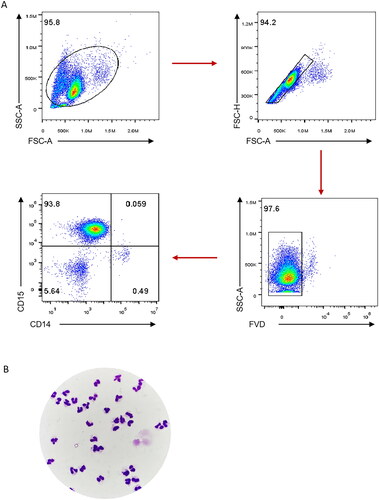
Figure 2. Basic information of hsa_circ_0000479 and PCR product identification in neutrophils. (A) The schematic diagram of the genomic position of hsa_circ_0000479 is from EPSTI1 gDNA. (B) Percoll solution sorted neutrophils (1 × 10^6) from human peripheral blood was set to detect the expression of hsa_circ_0000479 by PCR. The transcript of human β-actin gene was used as an amplification control. The length of the product detected by PCR agarose gel electrophoresis was 181 bp. (C) PCR products were connected to T-easy vector and then sequenced by Beijing TsingKe Biotech Co., ltd with Sanger sequencing methods. The results of blast sequence alignment were consistent and validated the specific reverse splicing junction of hsa_circ_0000479.
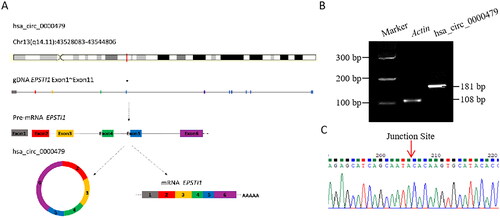
Figure 3. Up-regulated expressions of hsa_circ_0000479 in neutrophils of SLE. (A, B) Expression of hsa_circ_0000479 in the PBMCs and neutrophils of healthy controls (n = 8) (A) and SLE patients (n = 8) (B). (C) Expression of hsa_circ_0000479 in the neutrophils of healthy controls (n = 8) and SLE patients (n = 8). (D) Statistical results of hsa_circ_0000479 detected in the neutrophils of healthy controls (n = 45) and SLE patients (n = 80) by qPCR compared with internal reference β-Actin; Ns: no significance; **p < 0.01, ***p < 0.001 (Mann–Whitney U-test, A–D).
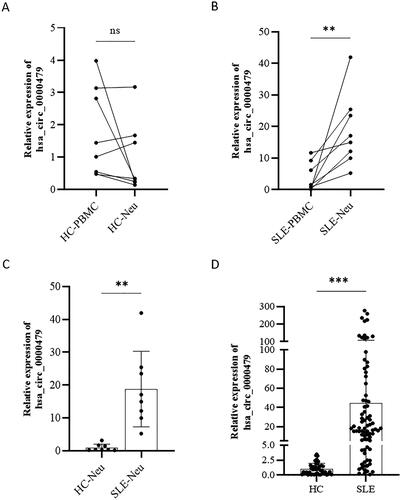
Figure 4. Correlation of hsa_circ_0000479 with SLE patients’ clinical and immunological features. The correlation of hsa_circ_0000479 levels with SLE patients’ age (A), white blood cell (WBC) (B), absolute neutrophil count (NEUT) (C), C3 (D), IgA level (E), IgG (F), IgM (G), anti-dsDNA antibodies (H) and anti-nucleosome antibodies (AnuA) (I) were analysed. *p < 0.05; **p < 0.01 (Spearman’s rank correlation test and benjaminiand hochberg correction, A–I).
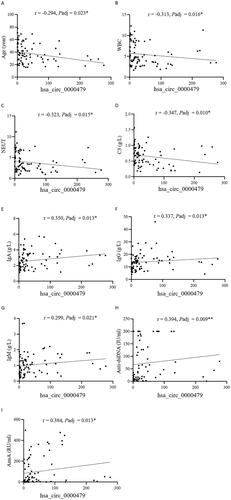
Figure 5. The expression of hsa_circRNA_000479 was increased in neutrophils of patients with positive autoantibodies. The levels of hsa_circRNA_000479 in SLE patients with or without autoantibodies. Sub-group analyses in SLE patients were performed according to the negative or positive of ANA (A), anti-dsDNA antibodies (B), anti-U1RNP (C), and anti-AnuA (D). *p < 0.05; **p < 0.01; ***p < 0.001 (Mann–Whitney U-test, A–D).
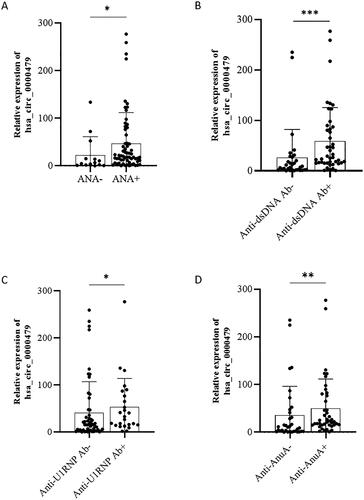
Table 2. Correlation of hsa_circ_0000479 with SLE patients’ clinical and immunological features.
Table 3. Association of hsa_circ_0000479 with SLE clinical features.
Figure 6. The expression level of hsa_circRNA_000479 in neutrophils is closely related to Treg and Teff cell subsets in SLE patients. The correlation of hsa_circ_0000479 levels with SLE patient Foxp3+ Treg cells (A) and Teff cells (B) were analysed. *p < 0.05; **p < 0.01 (Spearman’s rank correlation test, A,B).
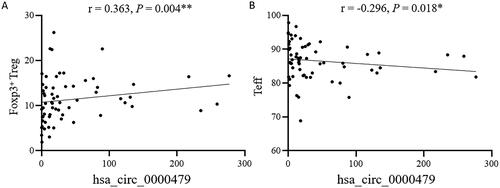
Table 4. Correlation between hsa_circRNA_000479 in neutrophils and immune cells in SLE patients.
Data availability statement
Data supporting the findings of this study are available from the corresponding author upon reasonable request.