
Figures & data
Figure 1. The expression characteristics of MUC1 in lung adenocarcinoma (LUAD). (A) the expression of MUC1 in normal and LUAD tissues; (B) the expression of MUC1 in different stages; (C) the expression of MUC1 in different T stages; (D) the expression of MUC1 in different N stages; (E) the expression of MUC1 in different M stages; (F) the expression of MUC1 in different genders; (G) the expression of MUC1 in different smoking history; (H) the protein expression of MUC1 in normal and LUAD tissues.
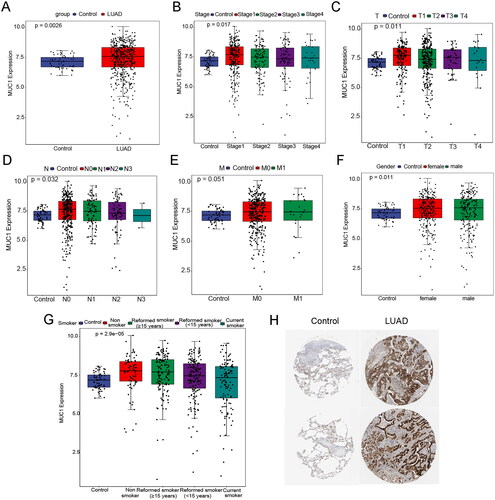
Figure 2. The immune infiltration analysis of MUC1 expression. (A) The immune cell infiltration in high-MUC1 group and low-MUC1 group; (B) the correlation between MUC1 expression and differential immune cells, the length of the line represents the correlation, the direction of the line represents the positive or negative correlation, and the colour and size of the end point represents p-value.
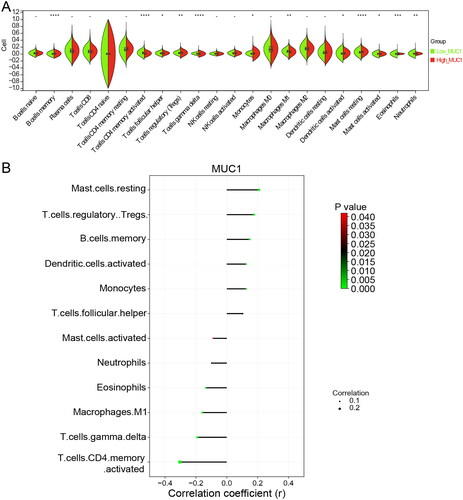
Figure 3. The immune correlation analysis between high-MUC1 group and low-MUC1 group. (A) The effect of MUC1 copy number variation on the immune cells infiltration in LUAD; B-E) the immune score M (B), stromal score (C), tumour purity (D), and ESTIMATE score (E) in high-MUC1 group and low-MUC1 group. *p < 0.05; **p < 0.01; *** p < 0.001; **** p < 0.0001.
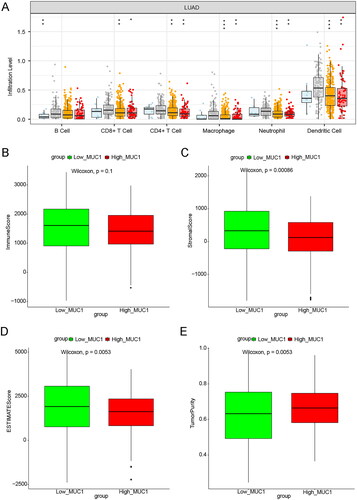
Figure 4. The expression of MUC1, EGFR, and IL-6 in A549 and A549/TAX cells. (A) The expression of MUC1, EGFR, and IL-6 in LUAD cells (A549) and paclitaxel-resistant LUAD cells (A549/TAX); (B) the protein expression of MUC1, EGFR/p-EGFR, and IL-6 in A549 cells and A549/TAX cells; **p < 0.01; *** p < 0.001; **** p < 0.0001.
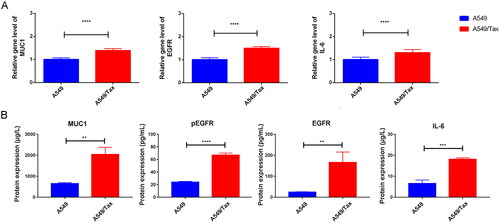
Figure 5. Cancer cell stemness increases in paclitaxel resistant LUAD cells. (A) The flow cytometry (FCM) assay for the expression of CD133; (B) the quantitative analysis showed that CD133 was significantly increased in A549/TAX cells; (C–F) the expression of nanog (C), Oct4 (D), Sox2 (E), and myc (F) in A549 cells and A549/TAX cells. **p < 0.01; *** p < 0.001; **** p < 0.0001.
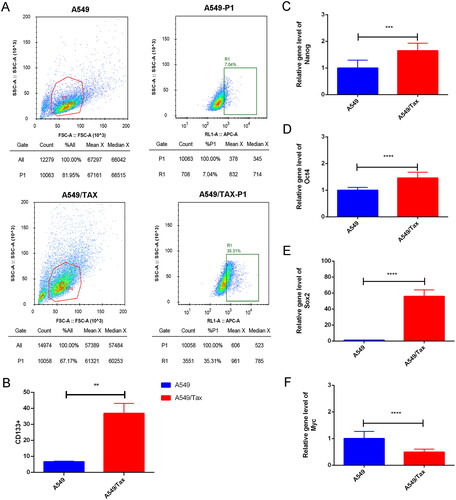
Figure 6. Knock down MUC1 reduces the expression of stem cell pluripotency factor in paclitaxel resistant LUAD cells. (A) screening of effective interference targets for knock down MUC1 in A549 cells and A549/tax cells; (B) cell Counting kit-8 assay (CCK-8) detects the cellular activity of negative control cells (A549/TAX-NC) and MUC1 interfering cells (A549/TAX-siRNA-MUC1); (C) the expression of MUC1, EGFR, and IL-6 in A549/TAX-NC and A549/TAX-siRNA-MUC1 cells; (D) the expression of Oct4, Sox2, and myc in A549/TAX-NC and A549/TAX-siRNA-MUC1 cells. *p < 0.05; **p < 0.01; *** p < 0.001; **** p < 0.0001.
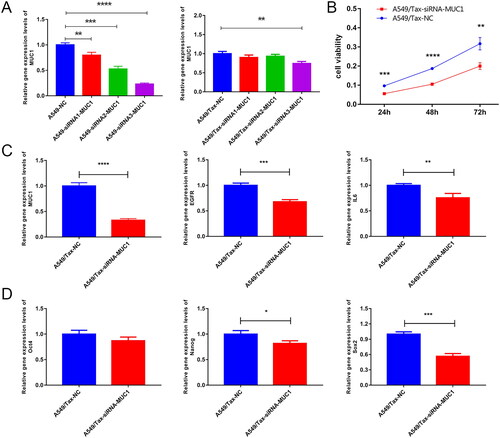
Figure 7. The differentially expressed genes analysis of between A549/Tax-NC and A549/TAX-siRNA-MUC1. (A–B) The volcano plot (A) and heat map (B) of DEGs between A549/Tax-NC and A549/TAX-siRNA-MUC1; (C–E) the expression of ABCB1 (C), ABCC2 (D), and ABCG2 (E) between A549/Tax-NC and A549/TAX-siRNA-MUC1.
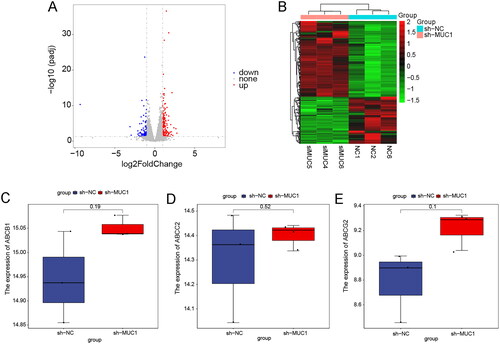
Table 1. The top 20 DEGs between A549/tax and A549/TAX-siRNA-MUC1.
Figure 8. GO and KEGG analysis of DEGs between A549/Tax-NC and A549/TAX-siRNA-MUC1. (A) The GO enrichment of up-regulated DEGs; (B) The KEGG pathway of up-regulated DEGs; (C) The GO enrichment of down-regulated DEGs.
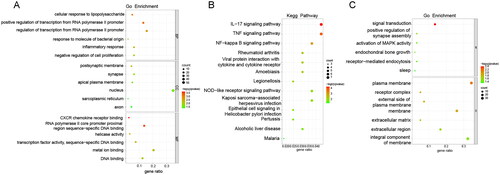
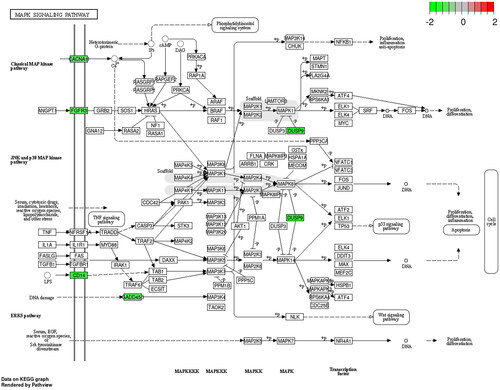
Figure 9. The KEGG pathway of down-regulated DEGs.
Supplemental Material
Download Zip (904.2 KB)Data availability statement
All data generated or analysed during this study are included in this published article.