
Figures & data
Figure 1. Histopathological evaluation in the early recovery phase following SI. Eyes with SI surgery were enucleated 2 weeks after surgery (SI group), and eyes without any treatment served as controls (n = 3 per group). (A) Macroscopic appearance of rabbit eyes with SI showed conjunctival hyperaemia and chemosis in the early postoperative phase and thickening and fibrotic tissue in the surgical area in the late phase. Original magnification: 10×. (B) Representative micrographs of tissue sections from the controls and SI group. Black asterisk marked the position of the silicone implant. H&E staining revealed significant inflammatory cell infiltration in the surgical area. Scale bar: 100 μm (20 μm within the enlarged box). (C) Immunofluorescent double staining of macrophages with anti-CD68 (red) and anti-CD206 (green) antibodies. There were more CD68+/CD206+ macrophages (white arrows) in surgical areas in SI group than in the controls. Scale bars: 50 μm.
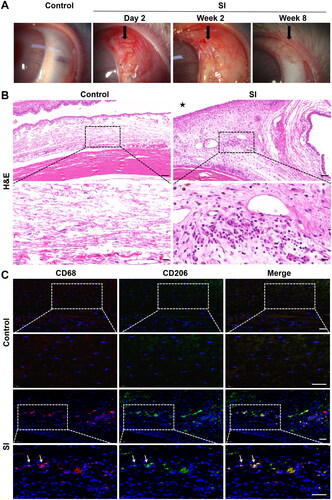
Figure 2. Histopathological assessment in the late remodelling phase following SI. Three eyes with SI surgery were enucleated 8 weeks after surgery (the SI group), and rabbits without any treatment served as controls (n = 3 per group). (A) H&E staining showed a more fusiform fibroblast-like appearance of cells (black arrows) and more compact collagen deposition surrounding the implant compared to the controls. Black asterisk marked the position of the silicone implant. Scale bar: 100 μm (50 μm within the enlarged box). (B) Masson’s trichrome staining demonstrated dense collagen bundles in blue. Black asterisk marked the position of the silicone implant. (C) Quantification of the Masson’s trichrome staining results. Scale bars: 50 μm. ***P < 0.001 compared to the controls; n = 3. (D) Immunofluorescence revealed significant expression of collagen I (red staining). White asterisk marked the position of the silicone implant. (E) Quantification of immunofluorescence staining for collagen I. Scale bars: 50 μm. **P < 0.01 compared to the controls; n = 3.
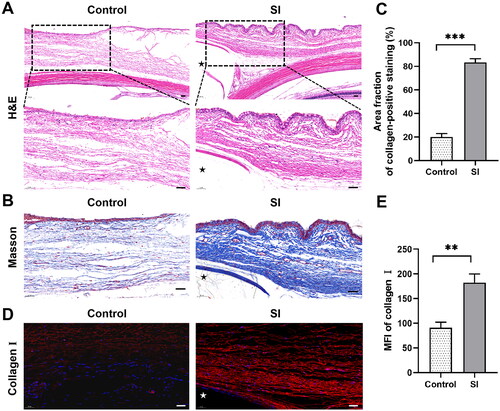
Figure 3. Differentiation of THP-1 cells into alternatively activated (M2) macrophages. (A) Different morphologic appearances of THP-1 cells that were untreated (THP-1), treated with PMA (M0) or treated with PMA and subsequently with IL4/IL13 (M2). THP-1 cells grew in suspension, while M0 and M2 were larger with increased adherence and more granules in the cytoplasm. Scale bar: 50 μm. (B) Representative flow cytometric analysis of untreated THP-1, M0 and M2 cells stained with allophycocyanin-conjugated monoclonal antibody anti-CD206. The MFI is shown on the x-axis, and the relative cell number on the y-axis. (C) Representative immunofluorescence images showing increased expression of CD206 in M2 cells compared to M0 macrophages. Scale bars: 10 μm. (D) Quantification of the results in (C). **P < 0.01; n = 3. (E) Representative immunofluorescence images showing stronger staining of pSTAT6 in M2 cells than that in M0 macrophages. Scale bars: 10 μm. (F) Quantification of the results in (E). **P < 0.01; n = 3. (G) Representative immunofluorescence images showing that the expression of TGF-β1 in M2 macrophages was stronger than in M0 macrophages. Scale bar: 10 μm. (H) Quantification of the results in (G). **P < 0.01; n = 3. (I) ELISA analysis of the cytokine TGF-β1 in M2 supernatant. **P < 0.01; n = 3. Similar results were obtained in three independent experiments.
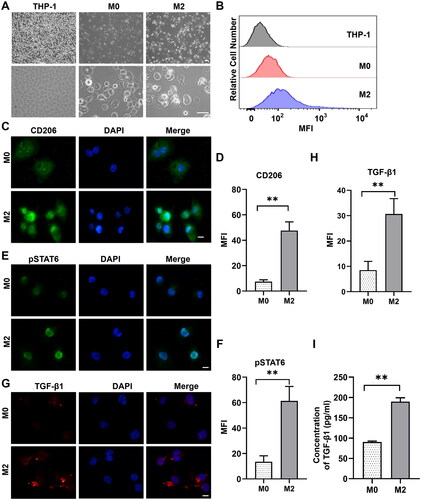
Figure 4. Characterization of primary HTFs. (A) Representative phase-contrast images of HTFs on days 3, 5 and 10. Scale bar: 100 μm. (B) Cells were stained with anti-vimentin antibodies and DAPI. Scale bar: 10 μm.
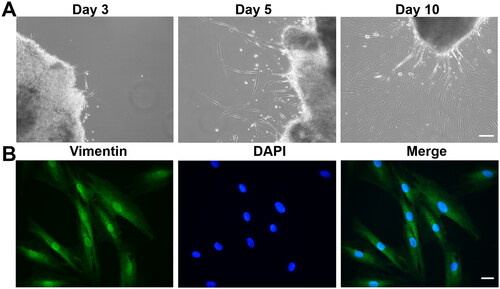
Figure 5. M2 supernatant promoted the migration of primary HTFs in wound healing assay. HTFs were cultured with M2-conditioned medium (M2 group) or fresh culture medium (control group). (A) Light microscopic images of the scratch wound area taken at 0 and 22 h in the presence or absence of M2 supernatant. Scale bar: 100 μm. (B) Quantitative analysis of the ratio of the cellular migration area to the initial scratch area; the initial scratch area in each group was set as 100%. All experiments were repeated three times independently. **P < 0.01.
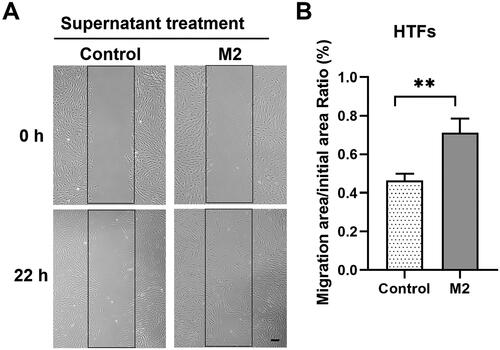
Figure 6. M2 supernatant promoted HTF activation and ECM synthesis. HTFs were treated with fresh culture medium (control), M2-conditioned medium only and verteporfin (VTP) (1.5 μmol/L, 3 h) followed by M2-conditioned medium treatment (M2/VTP) for 24 h. The expression levels of α-SMA, collagen I and fibronectin were evaluated by immunofluorescence staining. (A) Representative immunofluorescence images of HTFs stained with an anti-α-SMA antibody. Scale bars: 10 μm. (B) Quantitative analysis of the MFI of α-SMA. **P < 0.01, ***P < 0.001; n = 3. (C) Representative immunofluorescence images of HTFs stained with an anti-collagen I antibody. Scale bars: 10 μm. (D) Quantitative analysis of the MFI of collagen I. **P < 0.01; n = 3. (E) Representative immunofluorescence images of HTFs stained with an anti-fibronectin antibody. (F) Quantitative analysis of the MFI of fibronectin. *P < 0.05; n = 3. All experiments were repeated three times independently.
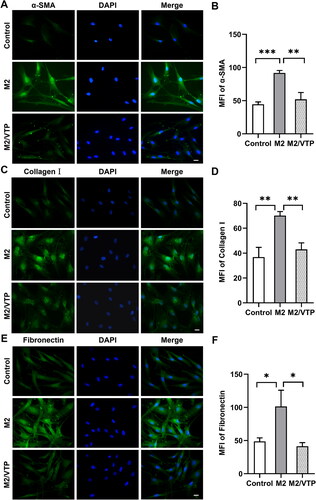
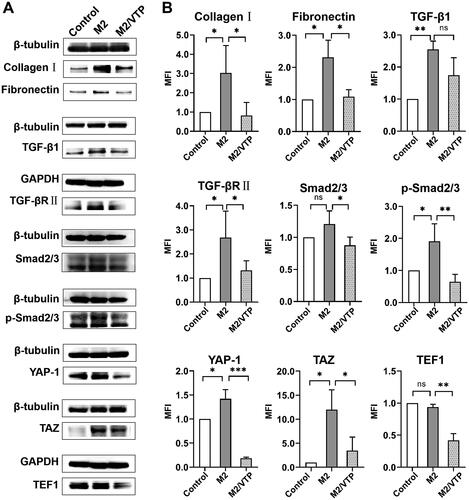
Figure 7. Crosstalk between YAP/TAZ and canonical TGFβ/Smad signalling contributed to M2 macrophage-induced fibrosis in HTFs. HTFs were treated with the fresh culture medium (control), M2-conditioned medium only and verteporfin (1.5 μmol/L, 3 h) followed by M2-conditioned medium treatment (M2/VTP) for 36 h. Protein levels of collagen I, fibronectin, YAP, TAZ and components of TGF-β1/smad signalling were determined by western blotting. (A) Representative images of western blot images. (B) Analysis of relative protein expression. GAPDH or β-tubulin was used as a loading control, as appropriate. *P < 0.05, **P < 0.01, ***P < 0.001; n = 3. All experiments were repeated three times independently. ns, not significant.
Supplemental Material
Download MS Word (5.5 MB)Data availability statement
The data that support the findings of this study are available from the corresponding author, Z. Li, upon reasonable request.