
Figures & data
Figure 1. Diagram of central airway measurement. (A) A three-dimensional reconstruction of the tracheobronchial tree from a 25-year-old female, presenting cross-sectional views of zones I-III and V-VIII. Annotations in the lower left corner of each section provide the mean airway wall thickness (AWT in mm) and airway luminal area (ALA in mm2). Subcarinal angle (SCA in degrees) is denoted in the green box, measured at 80.9 degrees; (B) a longitudinal cross-section matched to the yellow line in (a), with the blue line marking the measurement path along the airway’s length. Progressing from the left, the first yellow marker on the blue trajectory signifies the division into the right and left main bronchi, the second marker signals the entry to the right lung’s upper lobe, and the third marker delineates the convergence points to the right lung’s middle and lower lobes. ‘AL’ refers to airway length, ‘RMB’ is an abbreviation for the right main bronchus, and ‘RMLB’ represents the right middle lobar bronchus.
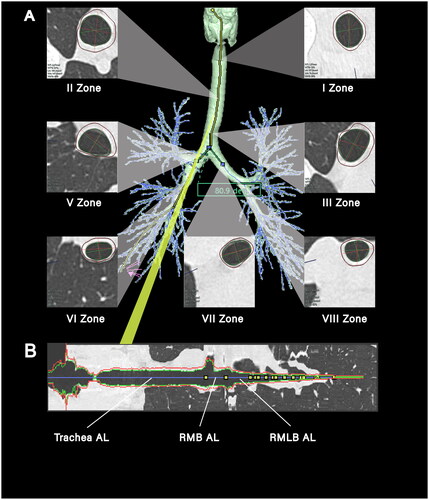
Figure 2. The demographics of the entire study Population and a comparison of males and females. (A) (B) (C) are divergent bar charts displaying the distribution of age, height, and weight, respectively, among the 888 examinees included in the study, categorized by sex. The inset tables in the lower left corner of each chart detail the mean, median, and standard deviation (SD) and the range [minimum, maximum] for each examinee. Additionally, the tables provide P-values for assessing statistical differences in age, height, and weight between male and female examinees.
![Figure 2. The demographics of the entire study Population and a comparison of males and females. (A) (B) (C) are divergent bar charts displaying the distribution of age, height, and weight, respectively, among the 888 examinees included in the study, categorized by sex. The inset tables in the lower left corner of each chart detail the mean, median, and standard deviation (SD) and the range [minimum, maximum] for each examinee. Additionally, the tables provide P-values for assessing statistical differences in age, height, and weight between male and female examinees.](/cms/asset/9b26fb9a-649b-4a14-a69a-843e4f010a4d/iann_a_2316258_f0002_c.jpg)
Figure 3. Comparative airway lengths and SCA by sex. The figure presents a series of box-and-whisker plots with superimposed individual data points, delineating the distribution of airway lengths in millimeters (mm) across various segments: trachea, right main bronchus (RMB), right superior lobar bronchus (RSLB), right middle lobar bronchus (RMLB), left main bronchus (LMB), left superior lobar bronchus (LSLB), and left inferior lobar bronchus (LILB). Additionally, the subcarinal angle (SCA) is depicted in degrees (deg). Data are stratified by sex, with each plot detailing the mean ± standard deviation (SD) and the median along with the range [minimum, maximum] for females (N = 456, in red) and males (N = 432, in blue). Levels of statistical significance are marked by asterisks (*** for p < 0.001); ‘NS’ indicates a lack of significant difference.
![Figure 3. Comparative airway lengths and SCA by sex. The figure presents a series of box-and-whisker plots with superimposed individual data points, delineating the distribution of airway lengths in millimeters (mm) across various segments: trachea, right main bronchus (RMB), right superior lobar bronchus (RSLB), right middle lobar bronchus (RMLB), left main bronchus (LMB), left superior lobar bronchus (LSLB), and left inferior lobar bronchus (LILB). Additionally, the subcarinal angle (SCA) is depicted in degrees (deg). Data are stratified by sex, with each plot detailing the mean ± standard deviation (SD) and the median along with the range [minimum, maximum] for females (N = 456, in red) and males (N = 432, in blue). Levels of statistical significance are marked by asterisks (*** for p < 0.001); ‘NS’ indicates a lack of significant difference.](/cms/asset/43679a5c-2ff0-4bd7-a680-da1dbd64254d/iann_a_2316258_f0003_c.jpg)
Figure 4. Comparative AWT by sex. This figure features a series of box-and-whisker plots with superimposed individual data points, displaying the distribution of airway wall thickness (AWT) in millimeters (mm) for seven zones: I zone, II zone, III zone, V zone, VI zone, VII zone, and VIII zone. The plots are color-coded to differentiate between female (N = 456, in red) and male (N = 432, in blue) examinees, with each plot providing detailed statistics including mean ± standard deviation (SD), median, and the range [minimum, maximum]. Significant differences between sexes are indicated by asterisks (*** for p < 0.001).
![Figure 4. Comparative AWT by sex. This figure features a series of box-and-whisker plots with superimposed individual data points, displaying the distribution of airway wall thickness (AWT) in millimeters (mm) for seven zones: I zone, II zone, III zone, V zone, VI zone, VII zone, and VIII zone. The plots are color-coded to differentiate between female (N = 456, in red) and male (N = 432, in blue) examinees, with each plot providing detailed statistics including mean ± standard deviation (SD), median, and the range [minimum, maximum]. Significant differences between sexes are indicated by asterisks (*** for p < 0.001).](/cms/asset/cc06a37c-2d71-4b2f-88aa-371ee12878fa/iann_a_2316258_f0004_c.jpg)
Figure 5. Comparative ALA by sex. This figure features a series of box-and-whisker plots with superimposed individual data points, displaying the distribution of airway lumen area (ALA) in square millimeters (mm2) for seven zones: I zone, II zone, III zone, V zone, VI zone, VII zone, and VIII zone. The plots are color-coded to differentiate between female (N = 456, in red) and male (N = 432, in blue) examinees, with each plot providing detailed statistics including mean ± standard deviation (SD), median, and the range [minimum, maximum]. Significant differences between sexes are indicated by asterisks (*** for p < 0.001).
![Figure 5. Comparative ALA by sex. This figure features a series of box-and-whisker plots with superimposed individual data points, displaying the distribution of airway lumen area (ALA) in square millimeters (mm2) for seven zones: I zone, II zone, III zone, V zone, VI zone, VII zone, and VIII zone. The plots are color-coded to differentiate between female (N = 456, in red) and male (N = 432, in blue) examinees, with each plot providing detailed statistics including mean ± standard deviation (SD), median, and the range [minimum, maximum]. Significant differences between sexes are indicated by asterisks (*** for p < 0.001).](/cms/asset/c10cdad0-2918-4e5f-a849-209344aa3eab/iann_a_2316258_f0005_c.jpg)
Figure 6. Correlation analysis of airway structural parameters and influencing factors (mean values). This heatmap depicts the correlation coefficients reflecting the strength and direction of associations between comprehensive airway structural parameters—airway lumen area (ALA) and airway wall thickness (AWT) across seven zones (I, II, III, V, VI, VII, VIII), the subcarinal angle (SCA), and the airway lengths(AL) (trachea, right main bronchus (RMB), right superior lobar bronchus (RSLB), right middle lobar bronchus (RMLB), left main bronchus (LMB), left superior lobar bronchus (LSLB), and left inferior lobar bronchus (LILB))—and influencing factors (age, height, weight) in both female and males. The color gradient encodes the correlation’s nature and strength: reds indicate positive correlations, with darker hues signifying stronger positive relationships, and blues represent negative correlations, with deeper blues denoting stronger negative relationships. Each cell specifies the correlation coefficient and asterisks (*) mark statistical significance at p < 0.05. The color scale on the side provides a reference from -1.0, indicative of a strong negative correlation, to +1.0, indicative of a strong positive correlation.
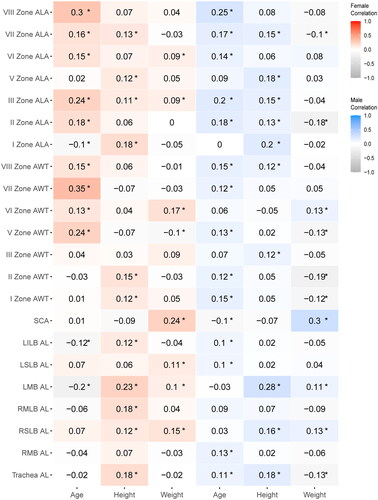
Figure 7. Relationships with absolute values of correlation coefficients greater than 0.2. (A) The relationship between LMB length and height; (B) The relationship between LMB length and age; (C) The relationship between SCA and weight; (D) The relationship between ALA in Zone I and height; (E) The relationship between ALA in Zone III and age; (F) The relationship between ALA in Zone VIII and age; (G) The relationship between AWT in Zone V and age; (H) The relationship between AWT in Zone VII and age. Data for females (red triangles) and males (blue circles) are indicated separately. Abbreviations: left main bronchus (LMB), the subcarinal angle (SCA), airway lumen area (ALA), airway wall thickness (AWT), and correlation coefficient (r).
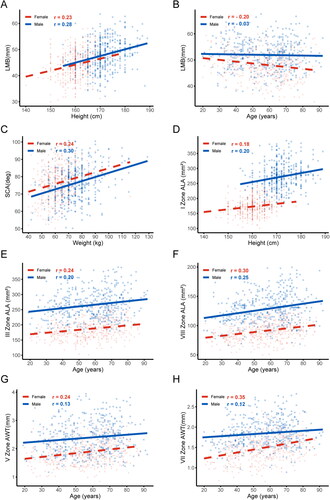
Table 1. Multiple linear regression analysis of AL and SCA.
Table 2. Multiple linear regression analysis of AWT.
Table 3. Multiple linear regression analysis ALA.
Table 4. AIC values from univariable models for subcategories of AWT and ALA.
Supplemental Material
Download Zip (3.8 MB)Data availability statement
The data that support the findings of this study are available from the corresponding author upon reasonable request.