
Figures & data
Figure 1. Flow chart of the study. BMI: body mass index
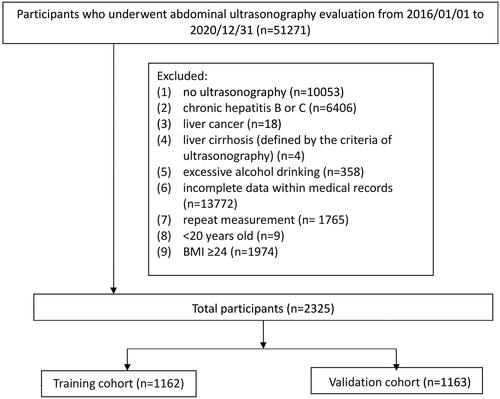
Figure 2. This heatmap visually represents the correlation matrix of 23 features, including age, sex, BMI, WC, BW, body fat, WHR, history of hypertension (HTN) and diabetes mellitus (DM), fasting glucose, exercise frequency, alcohol drinking frequency, platelet count, alkaline phosphatase, HbA1c, cholesterol, HDL-C, LDL-C, triglyceride levels, uric acid, muscle mass, visceral fat, and total cholesterol/HDL-C ratio. The color spectrum in the heatmap spans from deep blue, denoting positive correlations, to deep red, indicating negative correlations.
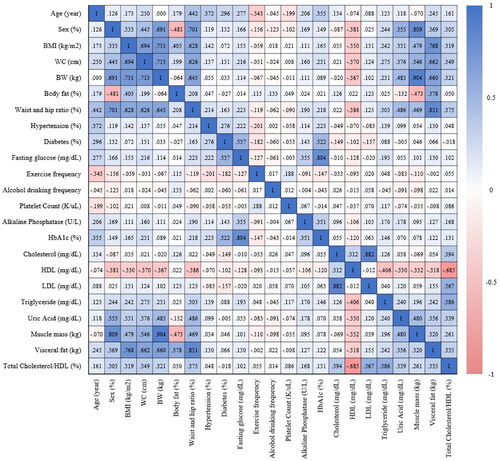
Table 1. Clinical characteristics of the training and validation sets.
Table 2. Demographic data comparison based on non-alcoholic fatty liver status, stratified from training set.
Table 3. Univariable and LASSO-derived multivariable logistic regression for predicting fatty liver in subjects with lean BMI.
Figure 3. Nomogram for lean nonalcoholic fatty liver disease prediction.
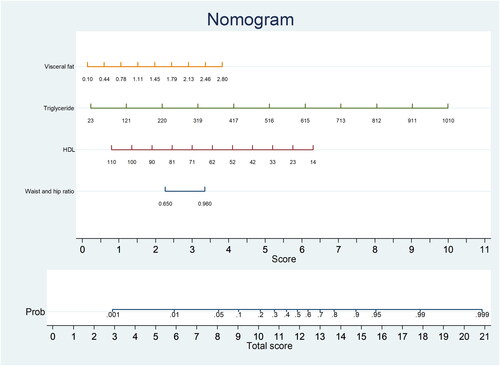
Table 4. Prediction performance of LASSO and FLI models, n = 1163.
Table 5. Prediction performance and comparison of LASSO and FLI models.
Supplemental Material
Download MS Word (28.5 KB)Data availability statement
The study questionnaires and raw data are available from the project PI via email: [email protected]