
Figures & data
Figure 1. Flowchart of the study participants. (a) The NHANES. (b) The SPEED-Shunde.
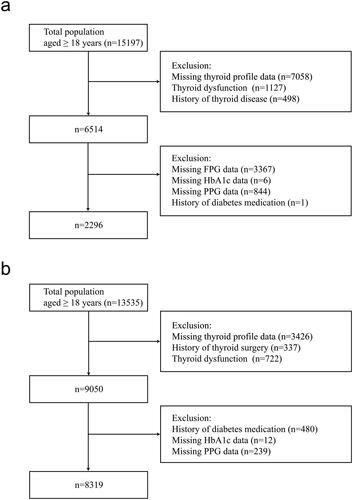
Table 1. General characteristics of participants in the study.
Table 2. Logistic regression analysis for the association between thyroid sensitivity indices and diabetes in the euthyroid population.
Figure 2. Non-linear relationships of thyroid sensitivity indices with diabetes. Restricted cubic spline (RCS) analysis was conducted. (a) FT3/FT4 ratio and diabetes in the NHANES (b) TFQIFT3 and diabetes in the NHANES (c) TFQIFT4 and diabetes in the NHANES (d) FT3/FT4 ratio and diabetes in the SPEED-Shunde (e) TFQIFT3 and diabetes in the SPEED-Shunde (f) TFQIFT4 and diabetes in the SPEED-Shunde. The model was adjusted for sex, age, BMI, eGFR, hypertension, thyroiditis, dyslipidemia, abused drink, education, smoking status and HOMA-IR in the SPEED-Shunde (further adjusted for race/ethnicity in the NHANES).
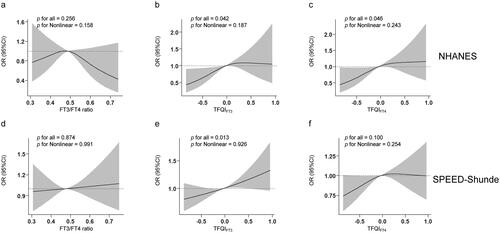
Figure 3. Associations of thyroid sensitivity indices with diabetes stages using general ordinal logit regression. Thyroid sensitivity indices quartiles and diabetes (a) in the NHANES and (b) in the SPEED-Shunde. The model was adjusted for sex, age, BMI, eGFR, hypertension, thyroiditis, dyslipidemia, abused drink, education, smoking status and HOMA-IR in the SPEED-Shunde (further adjusted for race/ethnicity in the NHANES).
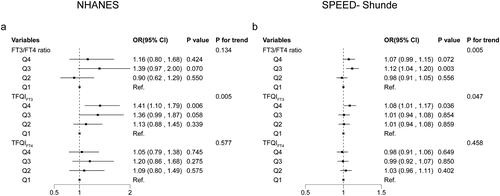
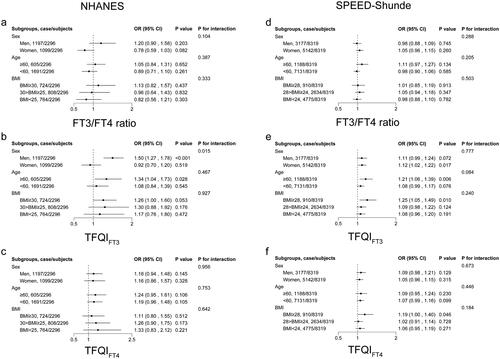
Figure 4. Stratification analysis stratified by sex, age and BMI. Associations of (a) FT3/FT4 ratio, (b) TFQIFT3 and (c) TFQIFT4 with diabetes in the NHANES. Associations of (d) FT3/FT4 ratio, (e) TFQIFT3 and (f) TFQIFT4 with diabetes in the SPEED-Shunde. The model was adjusted for sex, age, BMI, eGFR, hypertension, thyroiditis, dyslipidemia, abused drink, education, smoking status and HOMA-IR in the SPEED-Shunde (further adjusted for races in the NHANES).
Data availability statement
The data supporting the study findings are available from the corresponding authors upon reasonable request.