
Figures & data
Table 1. Baseline characteristics of the study population.
Table 2. Logistic regression assessing risk factors for POI.
Figure 1. The forest plots show the results of univariate (A) and multivariate (B) analyses. In the multivariate logistic regression model, six independent risk factors for POI were further screened out, including age older than 65.0 years (OR =2.090, CI = 1.321–3.305, p = 0.002), low body mass index (OR =3.021, CI = 1.760–5.186, p = 0.001), high body mass index (OR =1.581, CI = 1.035–2.417, p = 0.034), Constipation (OR =1.843, CI = 1.101–3.088, p = 0.020), Hypoalbuminemia (OR =2.749 CI = 1.555–4.861, p = 0.001) and Operative time (OR =3.023, CI = 2.289–3.994, p = 0.001).
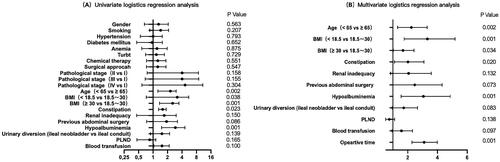
Figure 2. A nomogram model was established using independent risk factors screened out by multivariate regression analysis. The corresponding score for each factor is based on the condition of the patient, which can be determined by making a vertical line upwards (e.g. a patient with Hypoalbuminemia will receive 20 scores). Add all the scores to get the total score, then find the corresponding point on the total points axis and make a vertical line down to predict the risk of the POI after radical cystectomy.
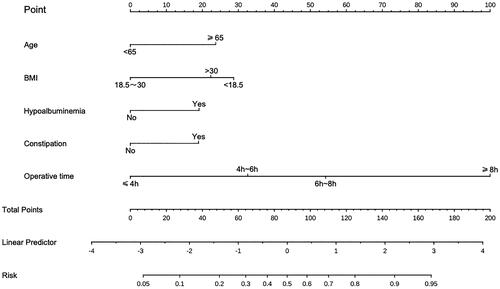
Figure 3. The AUC of training sample (A) and validation sample (B) showed that the model had a high discrimination ability.
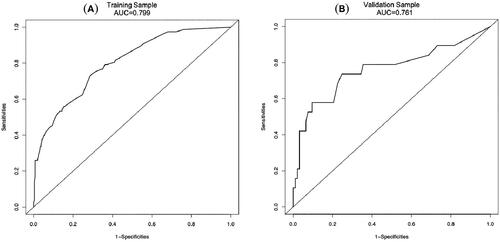
Figure 4. Calibration curves for training sample (A) and validation sample (B). The calibration curves for assessing the consistency between the predicted and the actual risk of POI. Favourable consistencies between the predicted and the actual risk evaluation are presented.
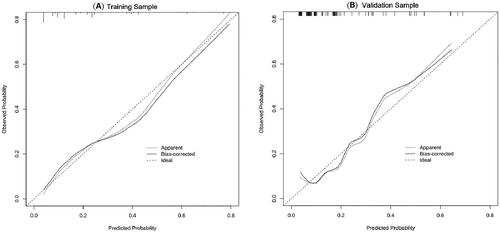
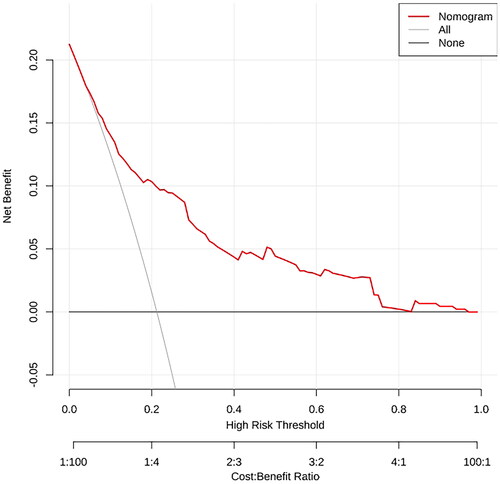
Figure 5. Decision Curve analysis for assessing the clinical usefulness of the nomogram. In this analysis, the decision curve provides a large net benefit across the range of 5.0% and 95.0%.
Data availability statement
The raw data of this study and more information can be found upon reasonable request from the author (SXY).