
Figures & data
Figure 1. Ultrasound imaging depicting stages of steatotic liver disease (SLD). The figure presents ultrasound images illustrating steatotic liver conditions in four different participants in this study. Liver steatosis was assessed by qualitatively comparing the echogenicity of the liver parenchyma to the echogenicity of the right kidney [Citation20]. (A) Normal liver, (B) Mild liver steatosis, (C) Moderate liver steatosis, and (D) Severe liver steatosis. The grading criteria for fatty liver included diaphragm images, which are not depicted in this figure.
![Figure 1. Ultrasound imaging depicting stages of steatotic liver disease (SLD). The figure presents ultrasound images illustrating steatotic liver conditions in four different participants in this study. Liver steatosis was assessed by qualitatively comparing the echogenicity of the liver parenchyma to the echogenicity of the right kidney [Citation20]. (A) Normal liver, (B) Mild liver steatosis, (C) Moderate liver steatosis, and (D) Severe liver steatosis. The grading criteria for fatty liver included diaphragm images, which are not depicted in this figure.](/cms/asset/e8e31575-16c6-48ed-9cc4-5a2855caf29d/iann_a_2329133_f0001_c.jpg)
Figure 2. Study diagram.
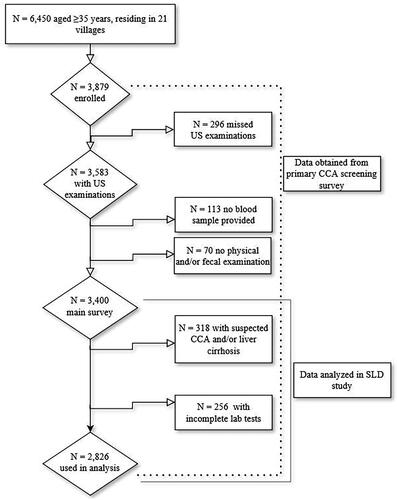
Table 1. Distribution of socio-demographic and economic factors among study participants, overall and according to the absence or presence of steatotic liver disease.
Figure 3. Distribution of BMI levels according to steatotic liver disease severity. Note: dash line on y-axis represents a BMI level of 23.0 kg/m2; SLD - steatotic liver disease.
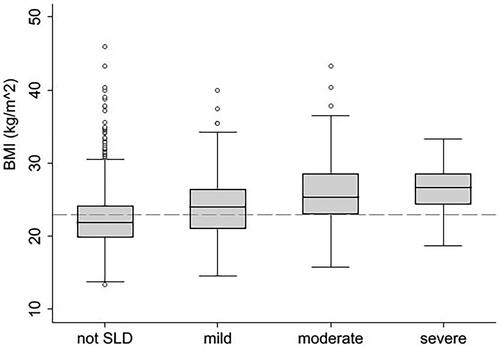
Figure 4. Bivariate and multivariate associations between covariates and fatty liver disease, stratified by body mass index (lean < 23.0 kg/m2 and non-lean ≥23.0 kg/m2). Notes: SLD - steatotic liver disease; yr - year; SES - social-economic status; T2DM - type 2 diabetes mellitus; OV - Opisthorchis viverrini; HBV - hepatitis B virus; Red color - indicates lean; blue color: indicates non-lean; percentages on the left side: proportion of steatotic liver; dotted lines: bivariate model; solid lines: multivariate model; OR [95% CI]: odds ratio [95% confidence intervals]. Percentages in red and blue on the left represent the prevalence of steatotic liver disease.
![Figure 4. Bivariate and multivariate associations between covariates and fatty liver disease, stratified by body mass index (lean < 23.0 kg/m2 and non-lean ≥23.0 kg/m2). Notes: SLD - steatotic liver disease; yr - year; SES - social-economic status; T2DM - type 2 diabetes mellitus; OV - Opisthorchis viverrini; HBV - hepatitis B virus; Red color - indicates lean; blue color: indicates non-lean; percentages on the left side: proportion of steatotic liver; dotted lines: bivariate model; solid lines: multivariate model; OR [95% CI]: odds ratio [95% confidence intervals]. Percentages in red and blue on the left represent the prevalence of steatotic liver disease.](/cms/asset/b79f667d-7d1a-40ed-a8ef-f717b24ed321/iann_a_2329133_f0004_c.jpg)
Data availability statement
Data is available upon reasonable request to the corresponding author.